
Official websites use .gov
A .gov website belongs to an official government organization in the United States.
Secure .gov websites use HTTPS
A lock (
) or https:// means you’ve safely connected to the .gov website. Share sensitive information only on official, secure websites.
Not Just a Pretty Facet: New NIST algorithm for NV center diamond magnetometry speeds up experiments by an order of magnitude
Some might call it a diamond in the rough: NV center magnetometry, which uses specially adapted diamonds to make sensitive measurements of magnetic signals, is a promising technology for studying a wide range of topics from cell biology to computing. So far, scientists have shown the technique has high sensitivity, able to detect magnetic fields about 100 million times smaller than the field from a typical refrigerator magnet. In fact, it is so sensitive it can measure the firing of single neurons within living tissue.
Some researchers believe it has the potential someday to help scientists better understand neuron-related diseases such as multiple sclerosis. However, NV center magnetometry might be more useful now if it were more efficient.
Right now, to make a measurement, scientists shine green light onto the diamond. Emitted red light tells researchers information about the magnetic field to which the crystal was exposed.
But the time it takes to collect the relatively small amount of red light can make experiments prohibitively slow and expensive.
In a paper published in Physical Review Applied, NIST researchers report a major improvement to NV center magnetometry. The NIST team has created a set of algorithms that use machine learning methods to speed up measurements by more than an order of magnitude. An experiment that once took weeks could now take days.
Furthermore, the technique does not require expensive changes to hardware. It is all software-based.
“This is a compensation method,” said NIST physicist Robert McMichael, who created the algorithm with NIST’s Sergey Dushenko and Kapildeb Ambal. “It’s not going to help us collect more photons for each NV center experiment, but it helps us make the best use of the ones we’ve got.”
People who can directly benefit from this work include scientists who might use nanodiamond NV center sensors for their projects if they were less expensive and time-consuming to run. The algorithm can also be adapted for use on other types of experiments, including those at neutron beamline facilities, which could use a version of this software to shorten the amount of time it takes facility users to collect their data.
“I’m excited about these new results and can’t wait to apply them both in my own research and in my company,” said Patrick Maletinsky, a University of Basel physicist whose startup company Qnami makes and sells NV center diamond probe tips that can be used in atomic force microscopes. “I believe that these results can bring decisive advantages for our scientific work and customers."
Any gain in sensitivity directly translates to faster imaging, said Gabriel Puebla Hellman, CEO of QZabre, a startup company that also manufactures and sells NV center tips. “The NIST software will allow us to decrease measurement time from more than ten hours to less than four without a decrease in quality, significantly saving time,” Hellman said.
Diamonds Are a Physicist’s Best Friend
NV stands for “nitrogen vacancy.” To make an NV center, scientists start with an ultrapure diamond – a crystal of carbon atoms. They then add nitrogen and heat so that two adjacent carbon atoms are replaced by a single nitrogen atom and a gap in the lattice – a hole, or “vacancy.”
Together, the nitrogen atom and hole, sitting side by side in the diamond lattice, create a sensitive magnetometer – a device that measures magnetic fields.
So far, people have used NV centers to detect MRI-like signals from chemicals on the diamond’s surface. Eventually scientists may use these methods to study protein structure, which could help researchers study disease on a cellular level.
Beyond medical work, the technology can be used to study current flow and magnetism in atom-thin materials like graphene, which could be used someday for lighter-weight electronics.
What makes NV centers attractive to scientists is their relative sensitivity coupled with their small size. A more established magnetometry technology that uses Super-Conducting Quantum Interference Devices (SQUIDs) has higher sensitivity than NV centers. But NV centers can measure smaller objects, as small as 10 nanometers (nm, billionths of a meter). Also, although SQUIDs require expensive and bulky systems for cryogenic cooling, NV centers operate at room temperature and have a smaller footprint.
“There are a couple of magnetometers that are more sensitive, but none of them are this small,” McMichael said. “In the ‘space’ that includes all the uses for magnetometers, this one wins in the ‘small and sensitive’ corner.”
Despite its promise, a drawback of NV center technology is that experiments yield a small signal. Only about ten percent of the photons created in an experiment can be measured. So researchers have to run their experiments for a long time in order to collect sufficient data.
Help Me, Bayesian Algorithm, You’re My Only Hope
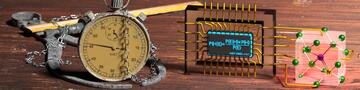
NV center diamond lattices can come in a few forms, depending on how scientists intend to use them. Researchers might embed the NV center in a diamond plate placed underneath the sample being studied. Or they might put the NV centers into nano-sized shards of diamond sprinkled onto the sample. An NV center can also be integrated into a diamond probe tip and attached to an atomic force microscope, where it can be manipulated across a sample to give researchers measurements with high spatial resolution.
Regardless of the setup, the data-collection process is roughly the same. The sample (a cell or piece of living tissue, for example) gives off a magnetic field that scientists are trying to measure. Scientists put the NV center diamonds and the sample into an optical microscope. They then shine green light onto the diamond, which fluoresces, absorbing the green light and emitting various amounts of red light in its place.
Here’s where it gets a little complicated.
Some atoms and fundamental particles such as electrons have a quantum property called spin. Spin is affected by magnetic fields.
The NV center acts as an object with three potential spin states, labelled 1, 0, and -1. Researchers expect to see different intensities of red light associated with different states. The different states – and therefore the different intensities – give them information about the sample’s magnetic field.
While scientists shine green light on the diamond and collect the red light fluorescing off it, they also flood it with microwaves, a type of light similar to the invisible signals used by cell phones.
To make a quantitative measurement of the sample’s magnetic field, scientists need to know which microwave frequencies correspond with those dips in red light intensity. They do this by sweeping microwave frequencies till they hit on one that dims the red light.
But this sweeping process is time consuming. It’s the equivalent of looking on every surface of your house for your keys; it’s much faster to search only in the places that are most promising – tables and counters – rather than, say, the back of your sock drawer or your bedroom ceiling.
That’s where the algorithm produced by NIST comes into play. The new software provides a feedback mechanism that instructs the system to look for slight dips in intensity of the red light, and then to home in on the microwave frequencies in that general area rather than doing a full sweep.
The process is designed as a Bayesian experiment, which describes a strategy where scientists’ next hypothesis is influenced by the results of their previous experiments. In this case, the input for the Bayesian algorithm is the intensity of the red light signal. As the intensity dips, the probability of useful data increases.
“The conventional way is to go from low to high and sweep the microwave frequency,” McMichael said. “The Bayesian way is to get smarter with each measurement and not necessarily go plodding along in a pre-planned path, but to find the most advantageous place to measure.”
In this way, the new method allows researchers to collect their data more than 40 times faster than they would without the algorithm. Each measurement itself takes a little more time but overall the experiment is much faster because researchers don’t have to take nearly as many measurements.
Beyond NV Centers
Bayesian algorithms are not new but had never before been applied to this problem. To adapt Bayesian algorithms for NV measurements, McMichael and colleagues used existing NV center data to create a model that would tell the software what signals to look for.
But, McMichael said, this same software could be further adapted for use with other types of experiments too, particularly ones that are expensive to run and take a relatively long time to collect a relatively small amount of information.
For example, there are potential applications at facilities that house neutron beam lines, which are useful for studying objects such as fuel cells, rock samples, and novel materials. Researchers rent time at neutron facilities, so anything that can speed up their data collection would save time and money.
Dan Neumann, a scientist at the NIST Center for Neutron Research (NCNR), estimates that an algorithm like this could improve NCNR’s efficiency by something like 30%, which would translate to a savings of about $10 million a year.
The software for NV center magnetometry is ready to use, the researchers said. “And we encourage people to use this software in other experiments too,” McMichael said. “A manual that comes with the software explains how to adapt the software for you own experiment.” The software and manual can be downloaded at https://pages.nist.gov/optbayesexpt/.
-- Reported and written by Jennifer Lauren Lee
Paper: S. Dushenko, K. Ambal and R.D. McMichael. Sequential Bayesian experiment design for optically detected magnetic resonance of nitrogen-vacancy centers. Physical Review Applied. Published online November 16, 2020. DOI: 10.1103/PhysRevApplied.14.054036
Public Data Resource: Optimal Bayesian Experimental Design Version 1.0.1. R.D. McMichael. Released April 13, 2020. https://doi.org/10.18434/M32230