
Official websites use .gov
A .gov website belongs to an official government organization in the United States.
Secure .gov websites use HTTPS
A lock (
) or https:// means you’ve safely connected to the .gov website. Share sensitive information only on official, secure websites.
Making the DNA Melt Curve More Accurate
NIST researchers find a new (mathematical) twist to improve DNA origami.
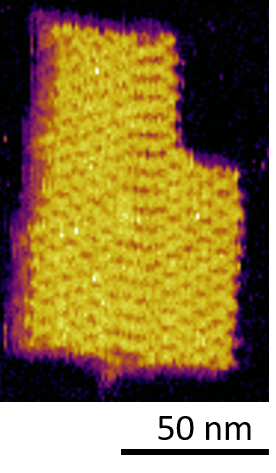
An example of DNA origami.
DNA is not only the blueprint of life; it has become the backbone for making tiny structures that can be inserted into the human body to diagnose and treat disease. In particular, researchers are setting their sights on a technique known as DNA origami, in which they meticulously assemble hundreds of strands of DNA to build a Lilliputian collection of structures that could include drug delivery containers, biosensors and other biocompatible devices.
In efforts that promise to dramatically improve this process, scientists at the National Institute of Standards and Technology (NIST) have now found a way to significantly enhance the accuracy of key information on how heat affects the stability of folded DNA structures.
To function reliably, these structures, only a few tens of nanometers (billionths of a meter) in length, must be carefully shaped in order, for example, to deliver drugs to specific targets. But the forces — hydrogen bonds — that bind pieces of DNA together to form the well-known double helix depend on both temperature and their local environment.
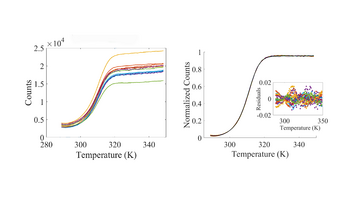
To determine how different strands of DNA react to changes in temperature, researchers rely on a series of measurements that form a graph known as the DNA melt curve. The curve reveals, for instance, the temperature at which half the strand has “melted,” or unraveled. It also shows the amount of heat the strands must absorb to raise their temperature by one degree C. By revealing these and other thermal properties of the strands, the curve provides scientists with the knowledge to design durable, more complex structures made from DNA.
As important as the DNA melt curve is, there remains a long-standing problem in accurately measuring it. Because of background effects and unknown sources of variability, dozens of identical DNA samples will have different melt curves, limiting scientists’ ability to extract meaningful information.
The NIST researchers have designed a novel mathematical algorithm that automatically accounts for these unknown effects, allowing scientists to reap the full benefits of the melt curve.
As scientists who have studied several ways to perfect DNA origami, NIST researchers Jacob Majikes and Alex Liddle were all too familiar with the inaccuracies plaguing the DNA melt curve. In principle, if they and other researchers could precisely reproduce all of the laboratory conditions under which they measured the curve, the uncertainties could be reduced.
But given the minute amounts of DNA in the experiments — no bigger than a water droplet — that was difficult to do in practice. So Majikes and Liddle reached out to a NIST mathematician, Anthony Kearsley, and his collaborator, NIST physicist Paul Patrone, in the hopes of finding a mathematical solution.
For Kearsley and Patrone, the challenge was irresistible: The true DNA melt curve was hidden in every set of measurements; the challenge was to find a way to reveal it. No known mathematical theory fully describes the melt curve, so the researchers had to figure out a way to remove the uncertainties in the melt curve using the experimental data alone. With so little information, it meant they had to be creative.
In searching for an algorithm that would solve this problem, the team recognized that the distortions to the true DNA melt curves were behaving in a straightforward manner. That is, the distortions were akin to a special kind of funhouse mirror — one that preserved the relative spacing between data points even as it contracted or expanded the curve, and that allowed parallel lines to remain parallel. To try and correct those effects, the scientists applied a mathematical tool known as an affine transformation.
Kearsley and Patrone were looking for a particular affine transformation — one that made each dataset conform to all the others, so that they would essentially look the same. But to find that transformation, using a technique known as constrained optimization, the scientists had to step away from the blackboard and immerse themselves in the mechanics of the DNA laboratory.
Neither Kearsley nor Patrone had even heard of DNA origami, let alone the measurements required to assemble the melt curve. They asked dozens of questions about each component of the nanoscale experiment, determining which parts were important to model and which were irrelevant. After weeks of theoretical calculations, Patrone got his first chance to view the actual experiment. He viewed in amazement the laboratory setup, with its 8x12 array of 96 tiny wells, each containing exactly the same sequence of DNA from which Majikes and Liddle had recorded 96 different DNA melt curves.
Armed with more than enough laboratory data, Kearsley and Patrone fleshed out the optimization problem they thought would work best to remove the errors. Then they applied the algorithm to each of the 96 curves and watched what happened.
On a computer screen, the multitude of curves, distorted in different ways, became indistinguishable, each tracing out the same shape, height and endpoints. The 96 curves had collapsed to become a single DNA melt curve.
“We were convinced we had solved the problem,” said Kearsley. The researchers report their findings in Volume 607 of Analytical Biochemistry.
Scientists have used DNA origami to fabricate nanorobots that perform computing operations and pre-programmed tasks inside living organisms. They have also relied on DNA origami to create miniature drug delivery containers that open only when they identify and attach to infected cells.
The team is now spreading the word about the success of their solution, alerting researchers who perform DNA origami that it is possible to accurately measure the melt curve and guide the growth of DNA origami structures. Just as importantly, said Patrone, the same technique could be applied to other biophysical problems in which the true data is obscured by similar types of errors. The researchers are studying how to improve the accuracy of experiments in which human cells flow through tiny cancer-hunting detectors.
Paper: Paul N. Patrone, Anthony J. Kearsley, Jacob M. Majikes and J. Alexander Liddle. Analysis and Uncertainty Quantification of DNA Fluorescence Melt Data: Applications of Affine Transformations. Analytical Biochemistry. Issue of October 15, 2020. DOI: 10.1016/j.ab.2020.113773