
Official websites use .gov
A .gov website belongs to an official government organization in the United States.
Secure .gov websites use HTTPS
A lock (
) or https:// means you’ve safely connected to the .gov website. Share sensitive information only on official, secure websites.
Data on Smoke Alarm Performance
A Compilation to NIST TN 1947
The data files are a compilation of experimental results referenced in NIST TN 1947 and include tabulated summary smoke alarm response results for smoke box and room experiments and individual experiment data files containing smoke beam obscuration, MIC current, gas species concentration, temperature and relative humidity measurements as a function of time during each experiment. Descriptions of the file name structures, data file contents and uncertainty estimates for each reported measurand are provided here.
The summary smoke alarm response results for the smoke box are contained in the file Excel spreadsheet titled “Smoke Box and Room Results”. There is a separate spreadsheet page for each alarm type which is labeled with the alarm models. In each spreadsheet page the alarm model and unit number results are presented on individual rows. Each unit was subjected to a single worst-case orientation experiment shown in the first set of columns, with unit 6 repeated two more times shown in the following two sets of columns. In some instances, repeated experiments were conducted on units 1 through 5 with results shown. Additional experiments with unit 6 where the flow velocity was increased by a factor of two, and where the smoke alarm was rotated 180 degrees to its best-case orientation are shown in subsequent columns. The alarm time and the obscuration and MIC current at the alarm time are presented. The combined standard uncertainty of alarm time is 1 s. The relative combined standard uncertainty of obscuration is 4.0 %, and the combined standard uncertainty of MIC current is 0.2 pA.
The file name structure for individual smoke box experiments starts with the model designation, a hyphen, then a letter from A to F indicating unit 1-6 respectively, a hyphen and finally three digits indicating the experimental configuration. The three digits 001, 002 and 003 are repeated worst-case orientation experiments, 004 is worst-case orientation at twice the flow velocity, and 005 is the best-case orientation. The first row is a date and time stamp, following that, the data is in tab-delimited columns starting with a column header, each described below.
Time This is the computer clock time for each data sample.
Counter This is an integer counter in seconds from the start of an experiment.
Transmittance (V) This is amplified the raw voltage in volts from the photocell circuit. The combined standard uncertainty is 0.0001 v.
Transmittance (%) This is the beam light transmittance derived from the ratio of the photocell raw voltage and the initial photocell raw voltage times 100. The relative combined standard uncertainty is 0.054×(100-transmittance %) %.
Obscuration (%/ft) This is the beam obscuration computed from the % transmittance and the path length of 5.00 ft. The relative combined standard uncertainty is 4.0 %.
MIC(pA) This is the MIC current in pA. The combined standard uncertainty is 0.2 pA.
Alarm? This is the state of a mouse-activated latching switch in the data program that is clicked when the operator hears an alarm.
CO This is the voltage output from the CO analyzer that is sampling the air from the smoke box. The conversation factor is volts×103.5 (ppm vol/volt) to convert the voltage to parts per million on a volume basis. Zero drift may require adjustment of initial value. The combined standard uncertainty is 2 ppm vol.
Microphone This is an indication of the microphone digital output. A change from 0 to 1 indicates the sound threshold was met during the 0.5 s sampling time that occurs each second. Repeated pattern of 1s indicated an alarm sounding.
Placing a wick inside the smoke box can disturb the beam light transmission from initial background values. This disturbance is carried over into the initial data reported for the light transmission and obscuration due to a running mean filter of the data. It is gone after 5-10 s and is an artifact that should be ignored.
The summary smoke alarm response results for the room experiments are contained in the file Excel spreadsheet titled “Smoke Box and Room Results”. There is a separate spreadsheet page for each alarm type which is labeled with the alarm models. A sample of a spreadsheet is shown below. The top row of a spreadsheet indicates the room experimental set-ups in groups of columns. The next two rows below each set-up are the column headers for the model/unit and the partial filename for a particular experiment. The next row below gives the particular model/ unit and the three experimental file name identifiers for the three repeated experiments that included the particular model/unit. The next three rows are the alarm time, and the obscuration and MIC current at alarm for each experiment. Subsequent rows repeat the model/unit, experimental file name identifiers and the alarm time, and the obscuration and MIC current at alarm for each experiment. The combined standard uncertainty of alarm time is 1 s. The relative combined standard uncertainty of obscuration is 4.0 %, and the combined standard uncertainty of MIC current is 0.2 pA.
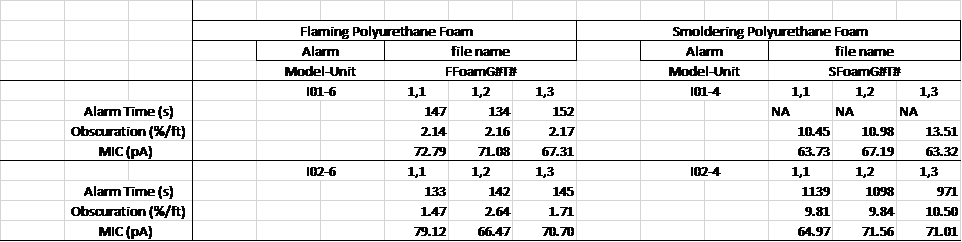

A particular experiment file name that corresponds to the tabulated values is constructed by replacing the # symbol with the first then second of the two comma separated numbers into the file name structure XXXXG#T# (e.g. FFoamG1T1 would be the first flaming polyurethane foam experiment conducted with model and unit I01-6.)
For each room experiment file the first row is a date and time stamp, following that the data is in tab-delimited columns starting with a column header, each described below.
Counter (s) This is an integer counter in seconds from the start of an experiment.
CO2 (vol %) This is the carbon dioxide concentration reading in volume % from the CO/CO2 analyzer. The combined standard uncertainty is 0.005 % vol.
CO (ppm vol) This is the carbon monoxide concentration reading from the CO/CO2 analyzer ppm vol. The combined standard uncertainty is 2 ppm.
T probe (deg C) This is the temperature reading from the humidity probe thermistor. The combined standard uncertainty is 1.0 oC.
Rel Hum (%) This is the relative humidty reading from the humidity probe thermistor. The combined standard uncertainty is 5.0%.
Range (kW) This is the electric range power in kilowatts. The combined standard uncertainty is 0.05 kW.
HCN (ppm vol) This is the hydrogen cyanide concentration reading from the HCN electrochemical cell sensor in ppm vol. The combined standard uncertainty is 0.1 ppm.
TC #1 (deg C) This is the room air temperature from the indicated thermocouple. The combined standard uncertainty is 1.0 oC.
TC #2 (deg C) This is the room air temperature from the indicated thermocouple. The combined standard uncertainty is 1.0 oC.
TC #3 (deg C) This is the room air temperature from the indicated thermocouple. The combined standard uncertainty is 1.0 oC.
TC #4 (deg C) This is the room air temperature from the indicated thermocouple. The combined standard uncertainty is 1.0 oC.
MIC (pA) This is the MIC current in pA. The combined standard uncertainty is 0.2 pA.
Trans (%) This is the beam light transmittance. The relative combined standard uncertainty is 0.054×(100-transmittance %) %.
Obsc (%/ft) This is the beam obscuration computed from the % transmittance and the path length of 5.00 ft. The relative combined standard uncertainty is 4.0 %.
Prior to the start of an experiment background scans of the MIC current, beam light transmittance and obscuration are recorded to verify initial clean air stability in the readings.
DOWNLOADS
- Smoke Box Data(zip file/1.4 MB)
- Room Data(zip file/2.4 MB)
- Smoke Box and Room Results(xlsx file/88 KB)
- NIST TN 1947 [DOI] [NVL]
Contact: Thomas Cleary
Contacts
-
(301) 975-6858