

Official websites use .gov
A .gov website belongs to an official government organization in the United States.

Secure .gov websites use HTTPS
A lock (
) or https:// means you’ve safely connected to the .gov website. Share sensitive information only on official, secure websites.


Design Fire Experiments - Tall Fir Trees
Research Overview
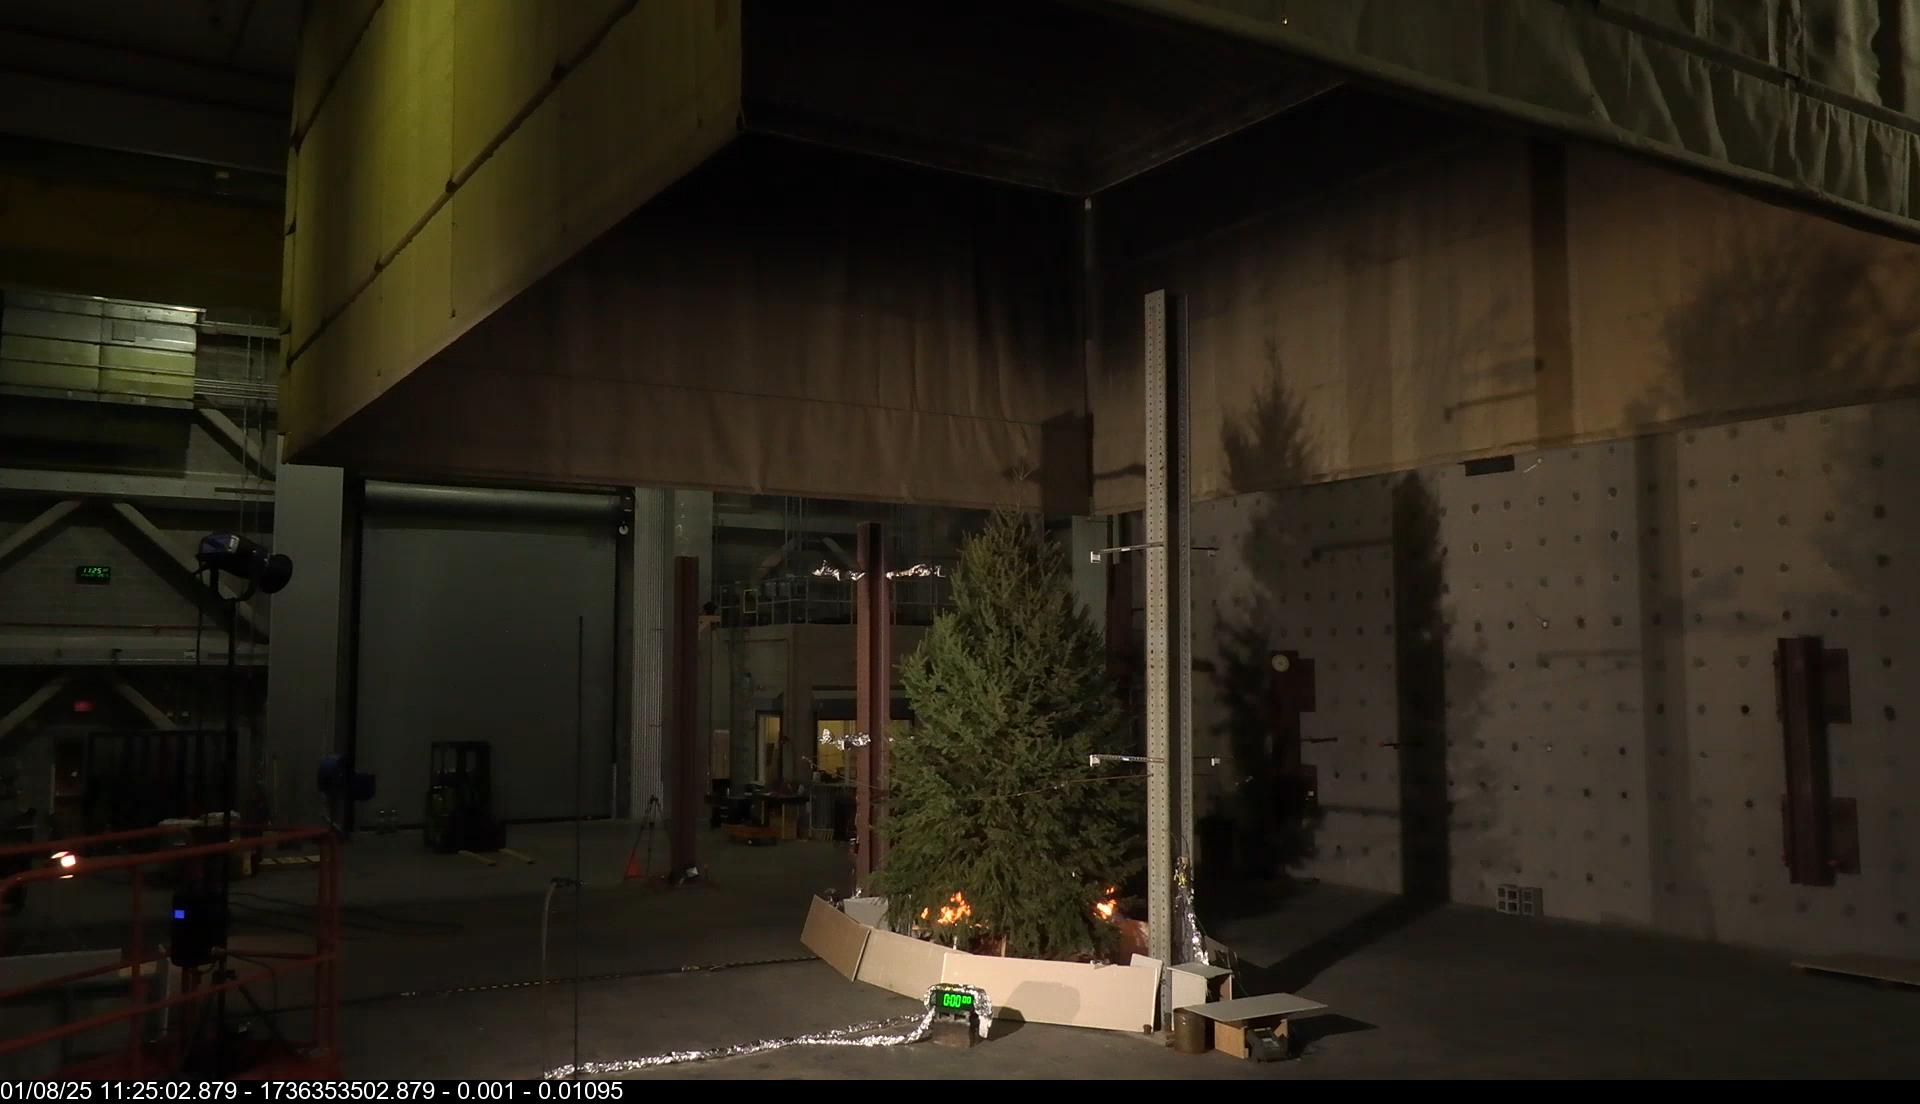
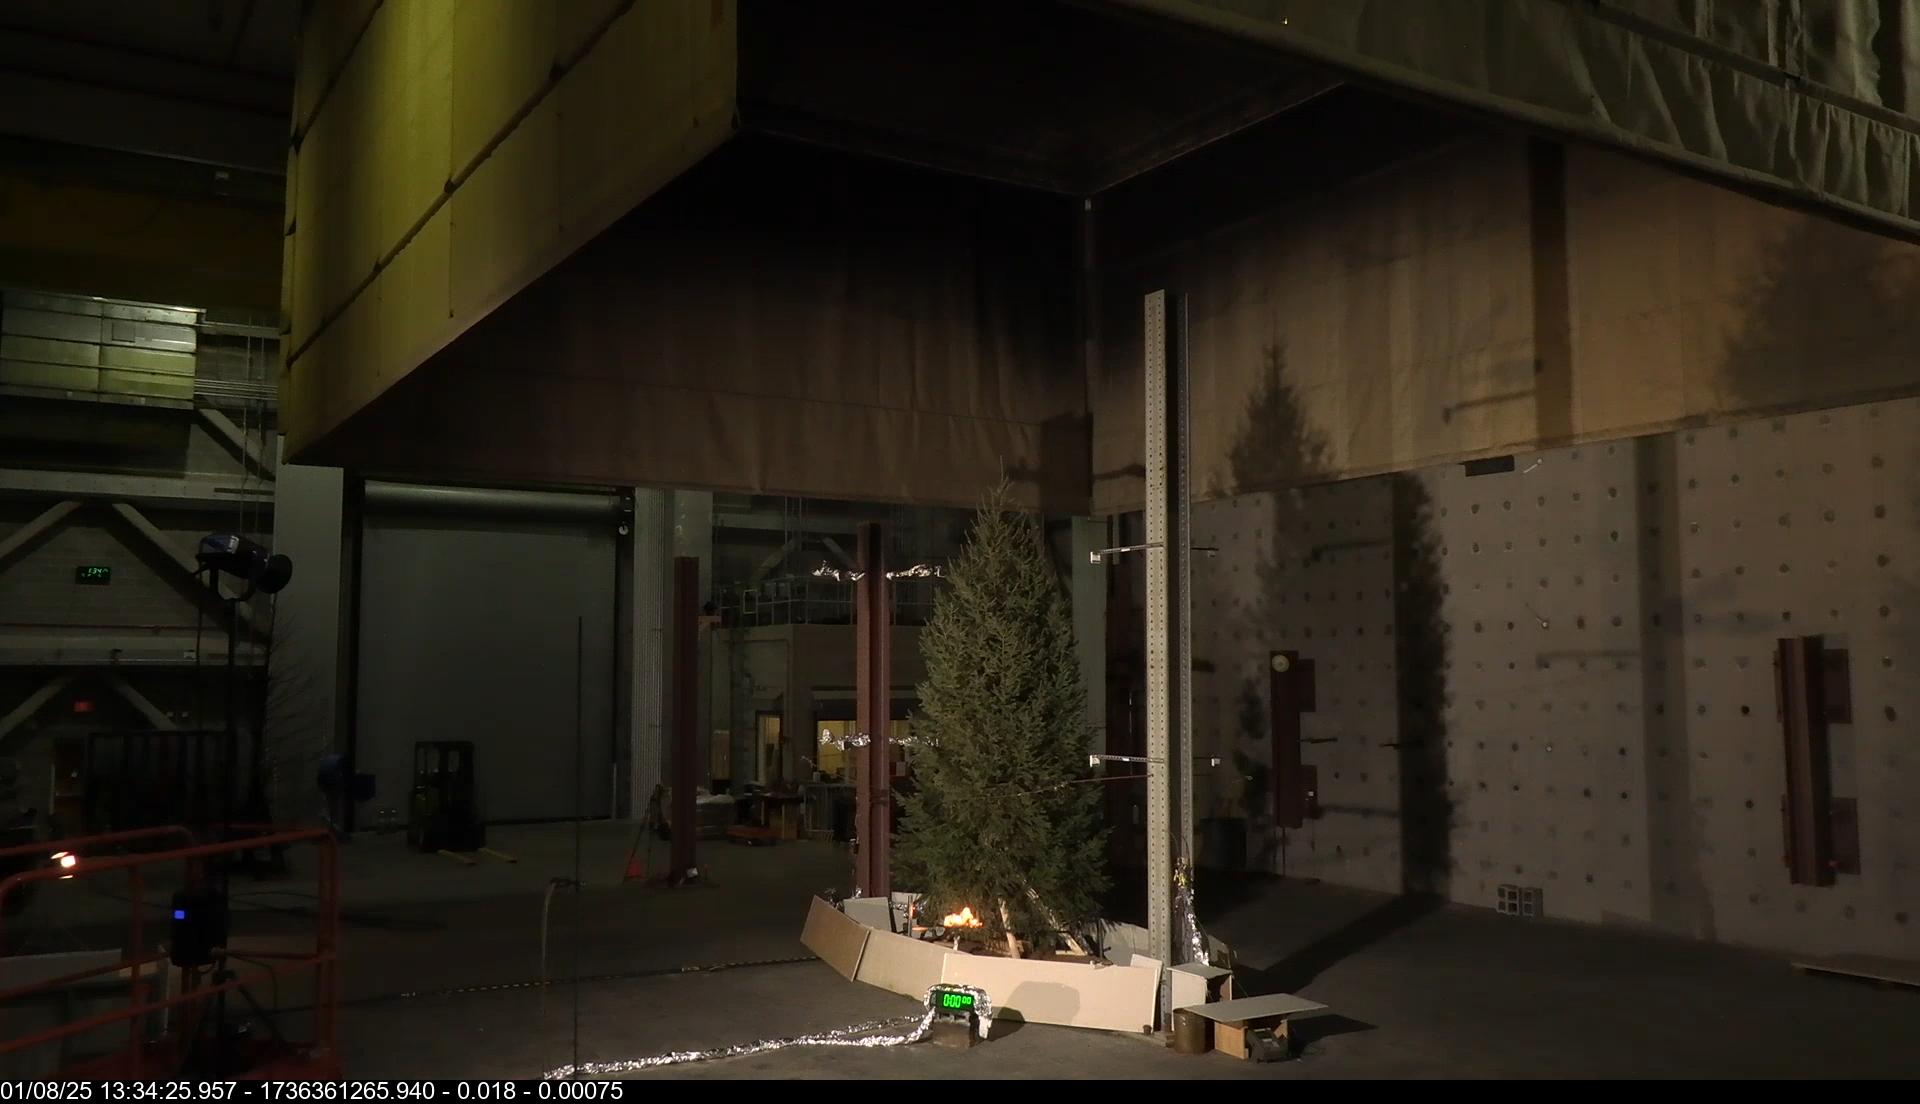
A series of experiments are reported on the burning behavior of 3.3 m to 7.4 m tall, Douglas fir treeswith the dry basis moisture content varying from 7 % to 55 %. The measurements were conducted in the open under quasi-quiescent conditions. The global measurements reported include the transient, peak, and total heat release rates, the yields of CO particulate matter, and PAH, the mass loss, and near and far-field heat fluxes. The appearance of the trees was captured by photogrammetry. The fires were documented by video cameras from several perspectives. Measurements of the heat flux to the surroundings from the specimens were used to estimate the radiative fraction of the fires. Photogrammetry documented the initial and final tree geometry and characterized the crown volume, while cameras recorded multiple perspectives of the fire’s evolution. The fires exhibited rapid growth, reaching peak HRRs within 7 s to 18 s after ignition with vertical flame spread as fast as 2 m/s. Higher moisture content was found to significantly decrease both the radiative fraction and the particulate matter yield.
A a rescaling methodology is presented, which corrects the transient heat release rate for system time response. The results provide unique calorimetric data which can be useful for development of design fire scenarios by fire protection engineers. The total heat release measured by oxygen consumption calorimetry and the ideal heat release from mass loss were in reasonable agreement. Post-fire analysis revealed thicker branch tip diameters as smaller fuel elements were consumed.
Notes: The initial and final specimen mass is reported on a dry basis. The time response of the oxygen consumption calorimeter was a significant source of uncertainty for these fast growing fires and the peak heat release values are significantly underestimated. A detailed analysis of the response time effect can be found in Appendix G of NIST TN 2362.
| Experiment Name | Plot of Heat Release Rate | Ignition Photo | Date/Time Sort descending | Specimen | Fuel Type | Test Duration (min) | Total Heat Released (MJ) | Peak HRR (kW) |
|---|---|---|---|---|---|---|---|---|
| Tree01 | 
|

|
12 ft Douglas Fir Tree | Cellulose | 3.93
|
169
|
7,536
|
|
| Tree02 | 
|

|
12 ft Douglas Fir Tree | Cellulose | 3.18
|
160
|
12,546
|
|
| Tree03 | 
|

|
14 ft Douglas Fir Tree | Cellulose | 2.27
|
154
|
8,969
|
|
| Tree04 | 
|

|
14 ft Douglas Fir Tree | Cellulose | 5.75
|
218
|
13,668
|
|
| Tree05 | 
|

|
18 ft Douglas Fir Tree | Cellulose | 2.80
|
594
|
36,611
|
|
| Tree06 | 
|

|
18 ft Douglas Fir Tree | Cellulose | 3.43
|
622
|
42,066
|
|
| Tree07 | 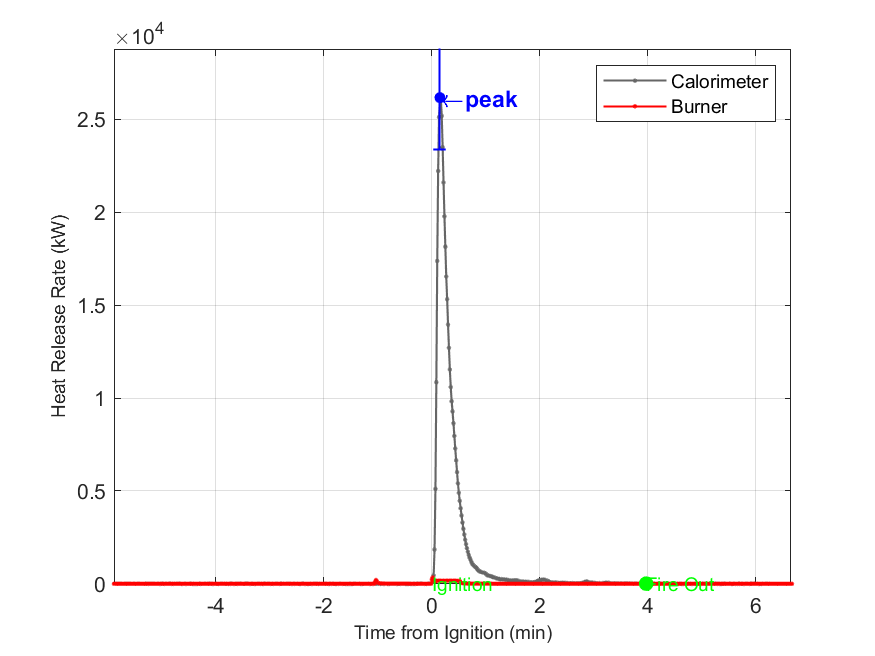
|
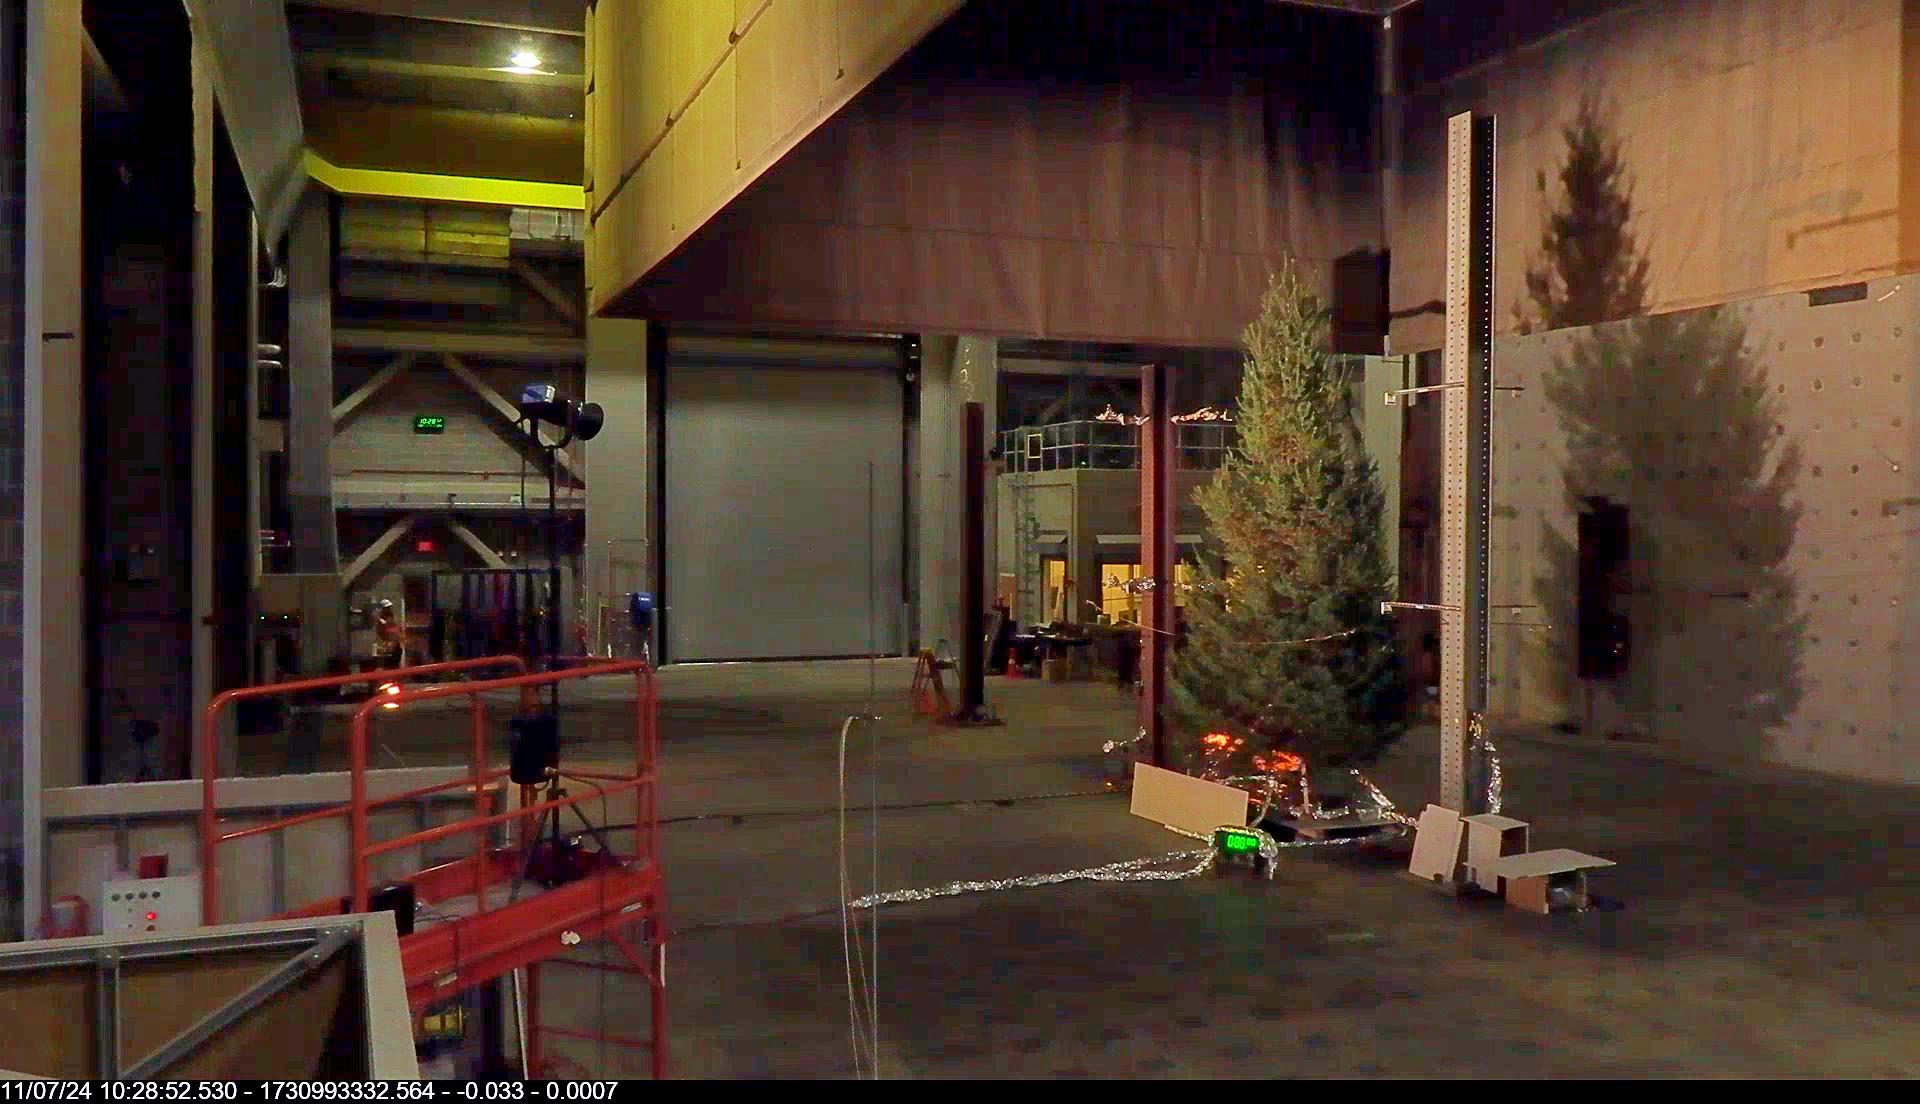
|
20 ft Douglas Fir Tree | Cellulose | 3.97
|
455
|
26,177
|
|
| Tree08 | 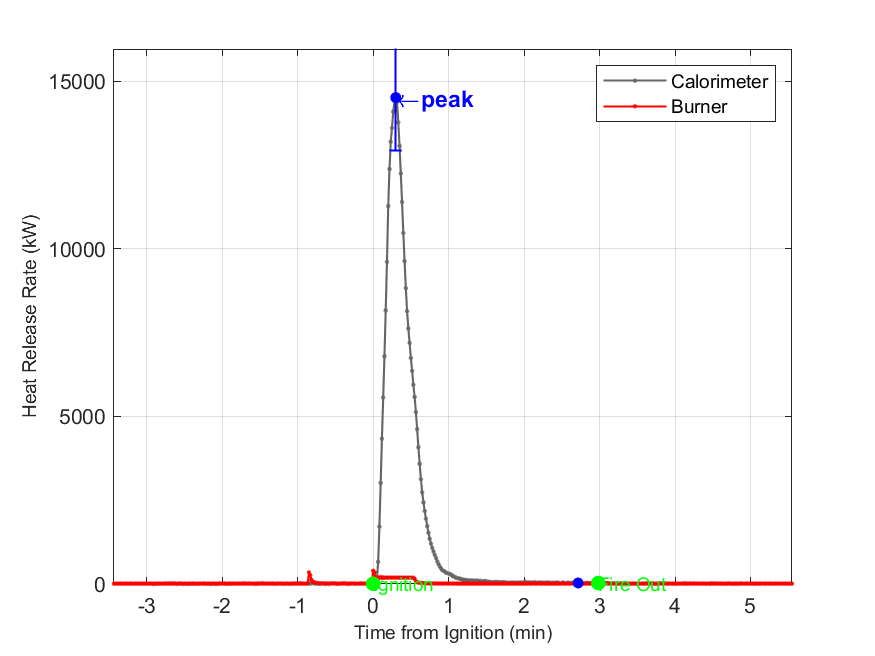
|
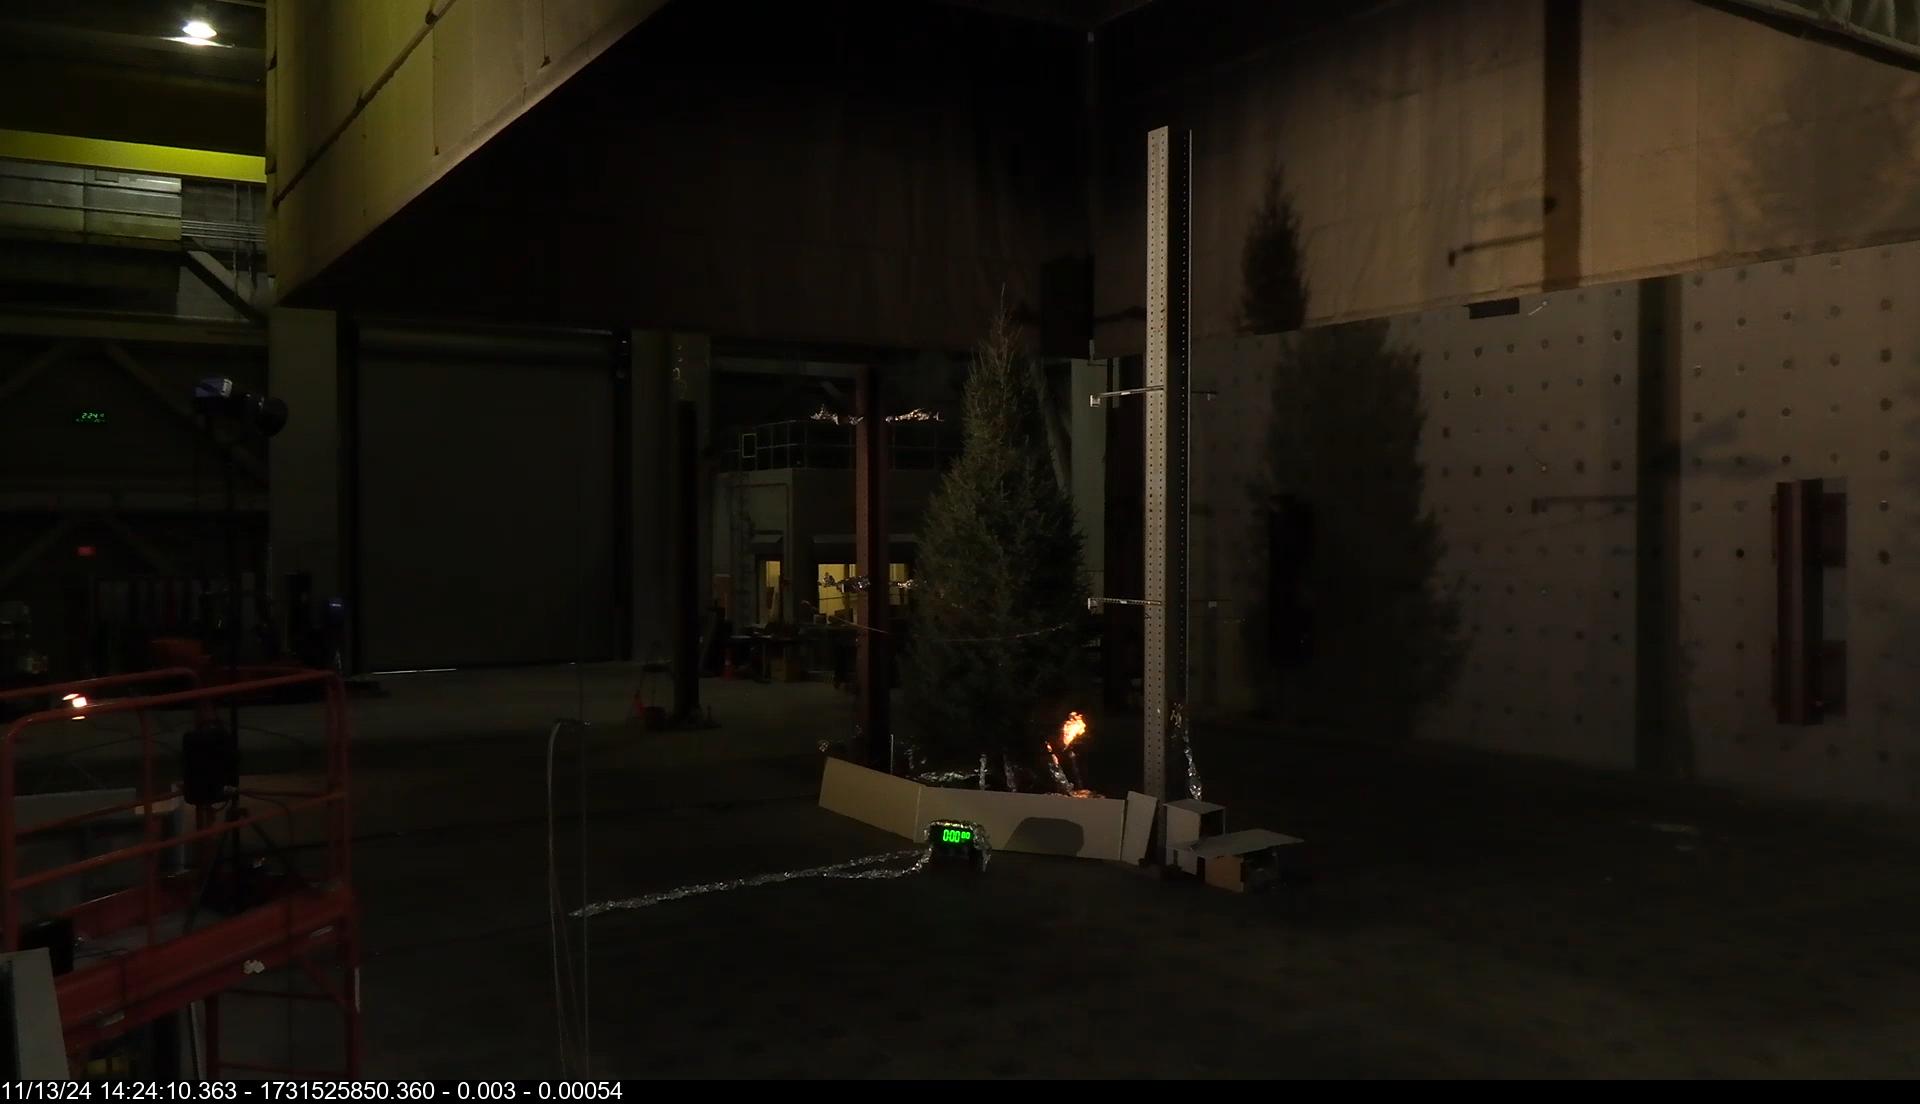
|
20 ft Douglas Fir Tree | Cellulose | 2.98
|
324
|
14,511
|
|
| Tree09 | 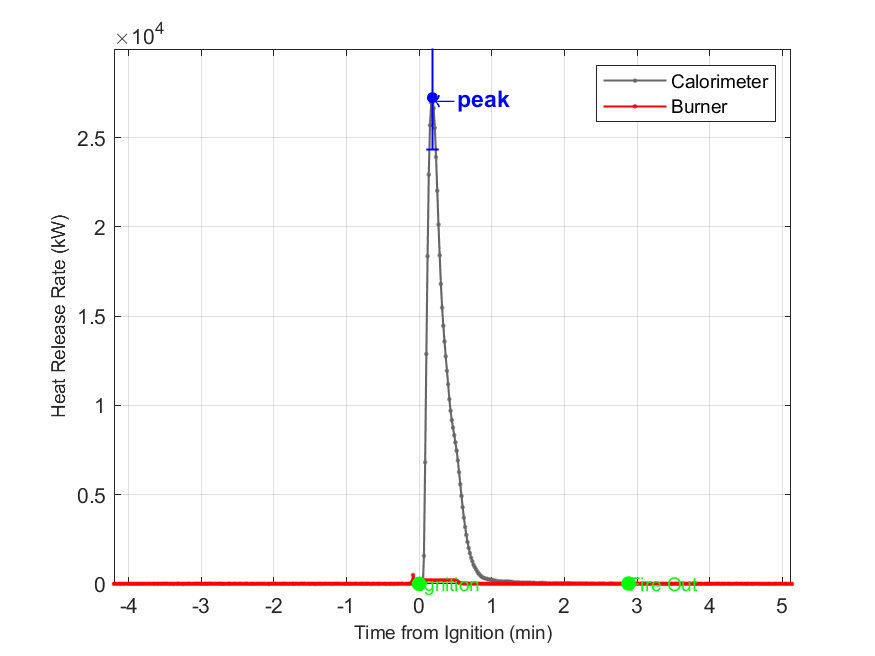
|
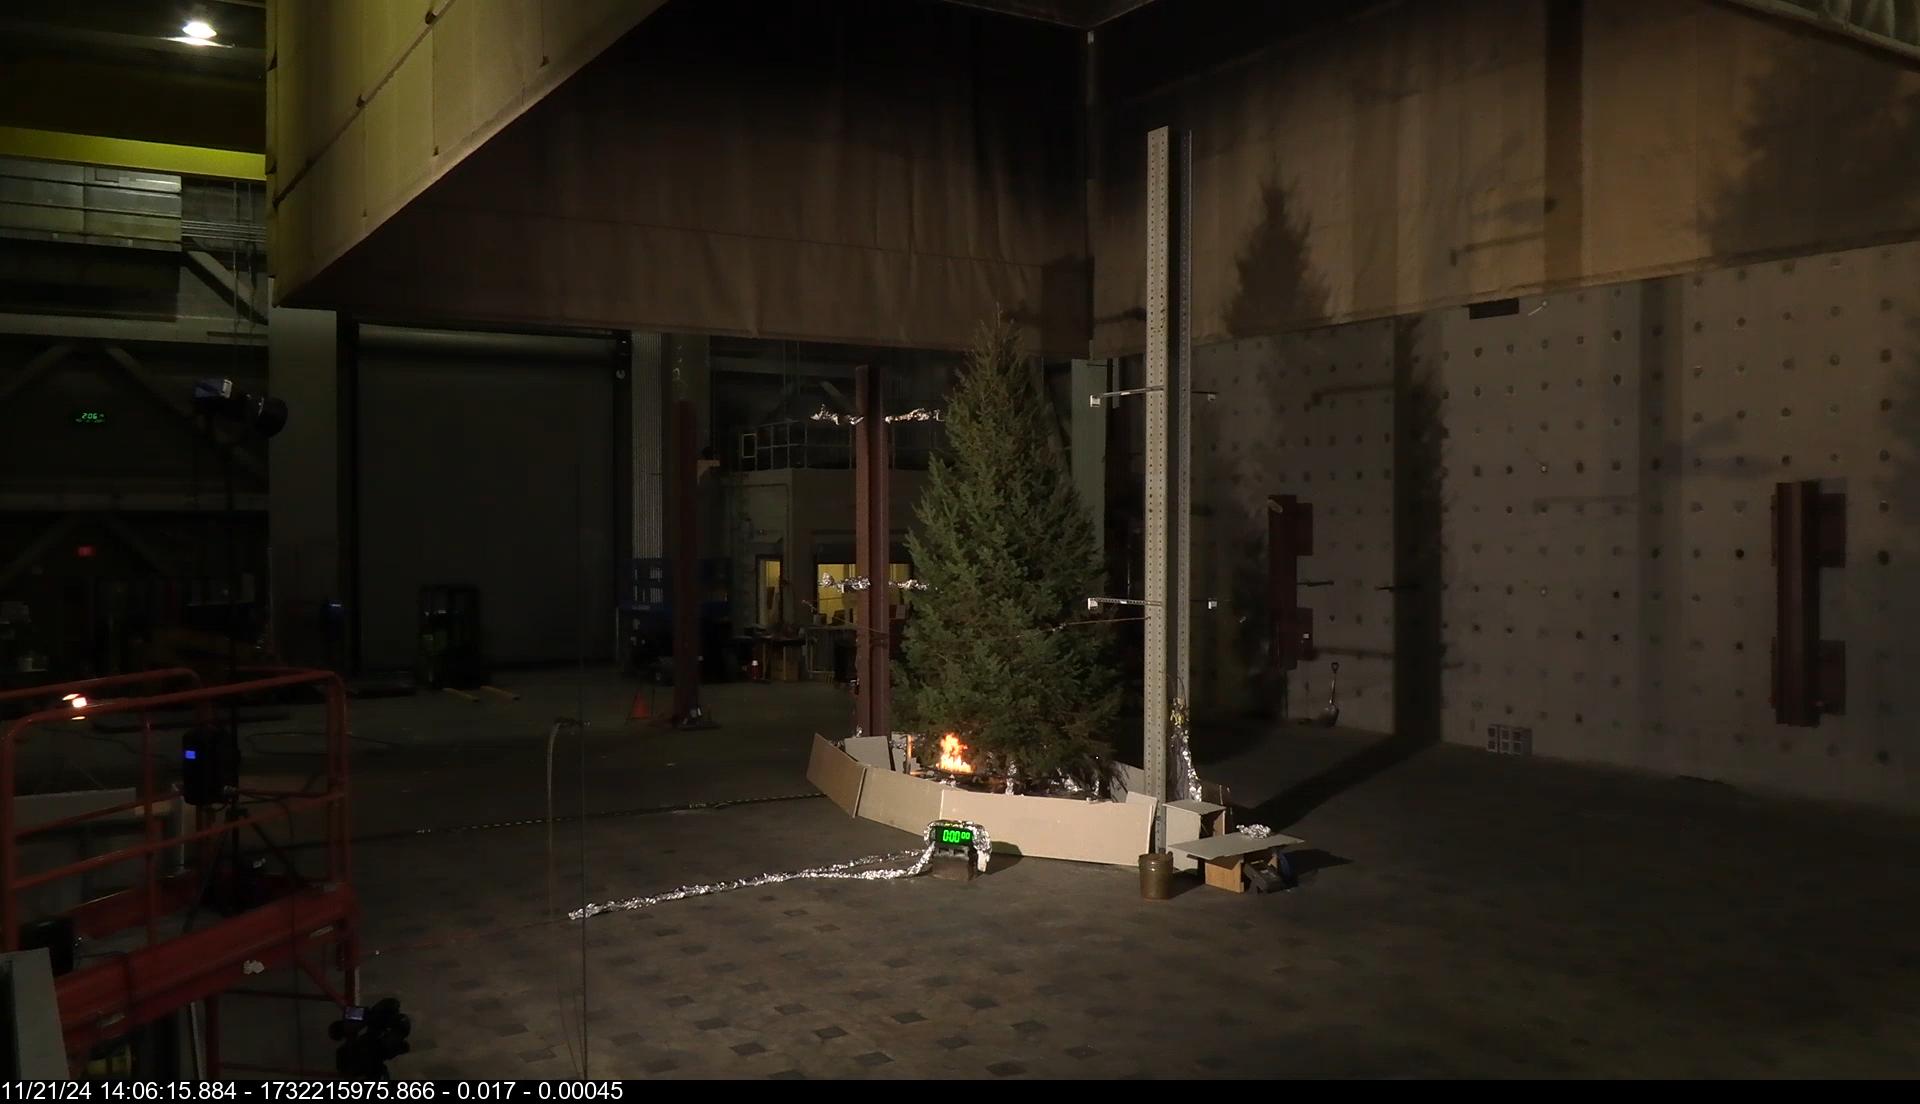
|
20 ft Douglas Fir Tree | Cellulose | 2.88
|
495
|
27,235
|
|
| Tree10 | 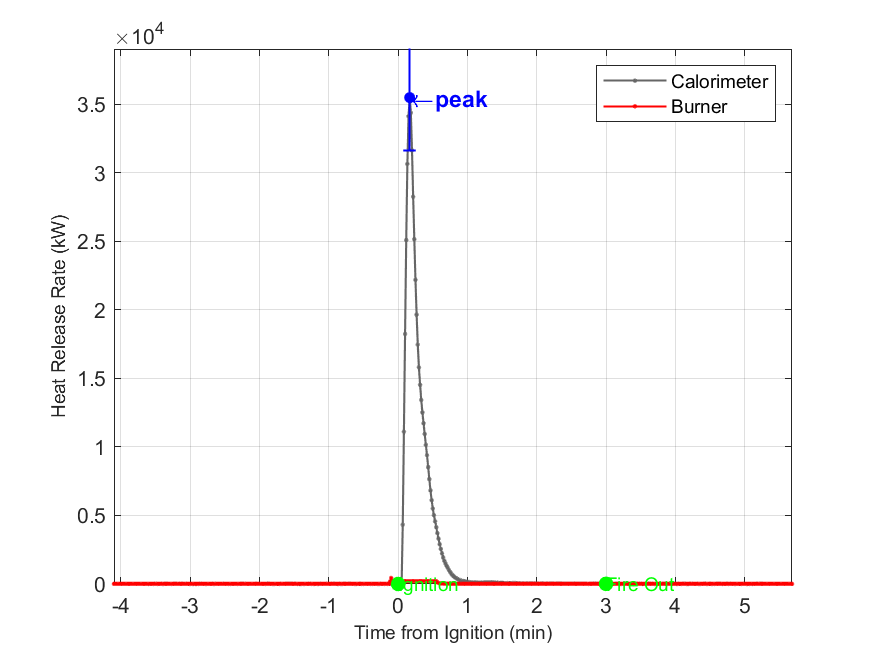
|
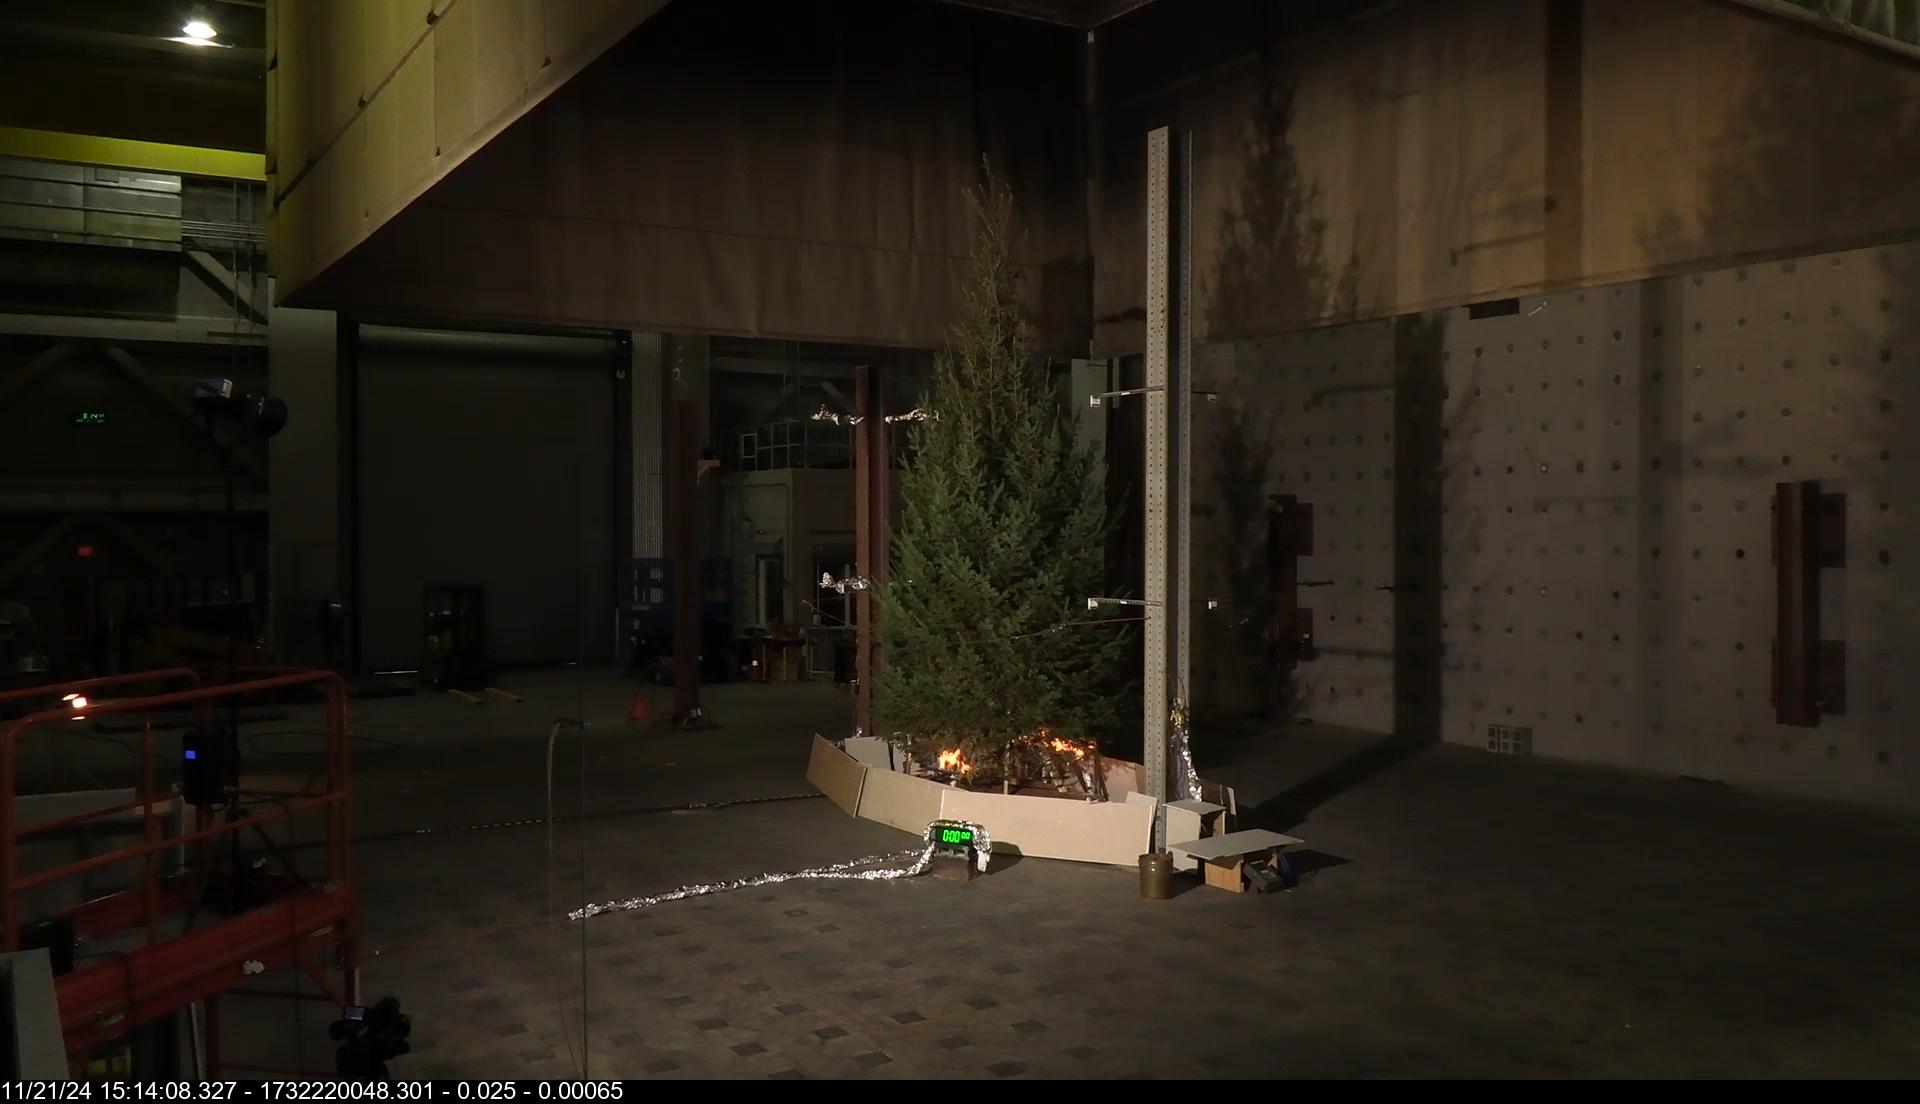
|
20 ft Douglas Fir Tree | Cellulose | 3.00
|
517
|
35,474
|
|
| Tree11 | 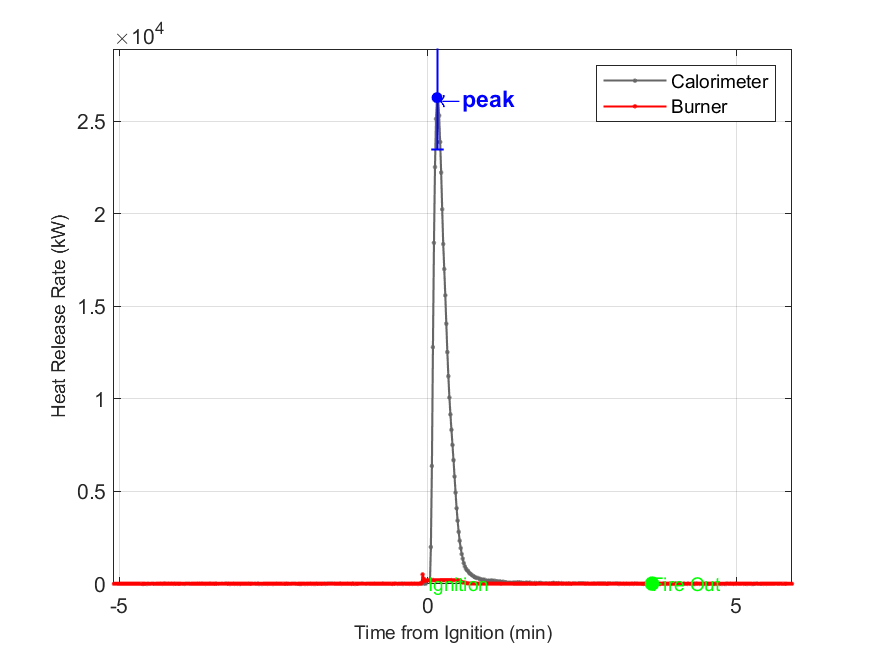
|
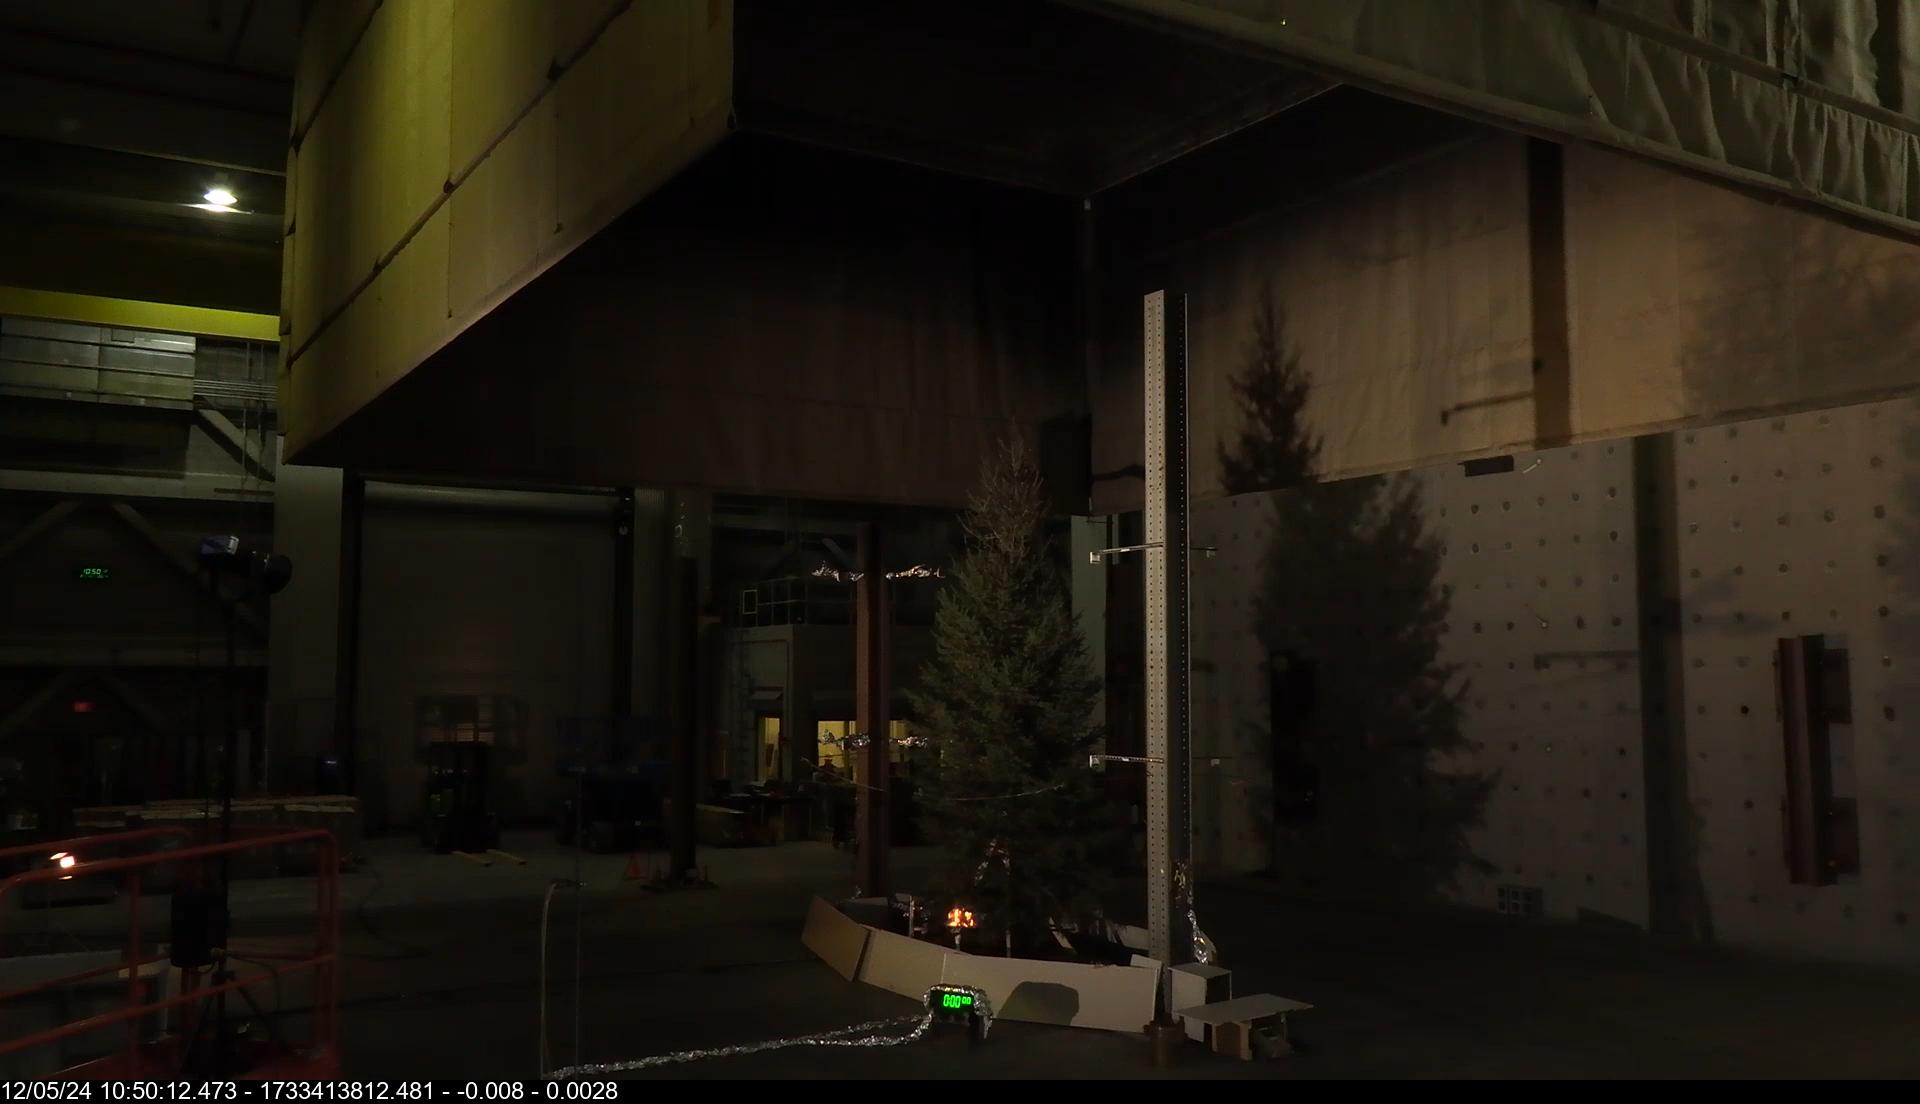
|
20 ft Douglas Fir Tree | Cellulose | 3.63
|
406
|
26,290
|
|
| Tree12 | 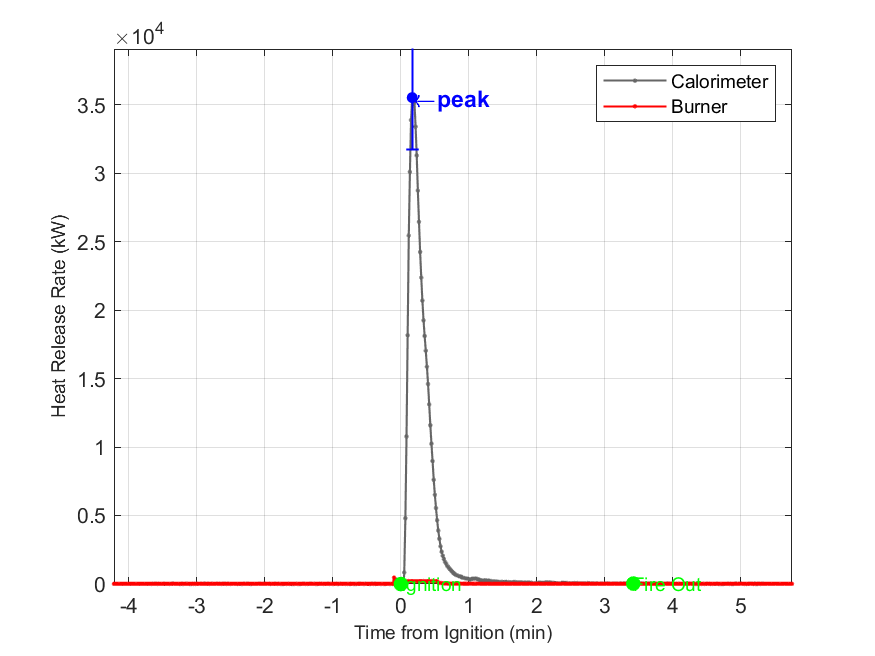
|
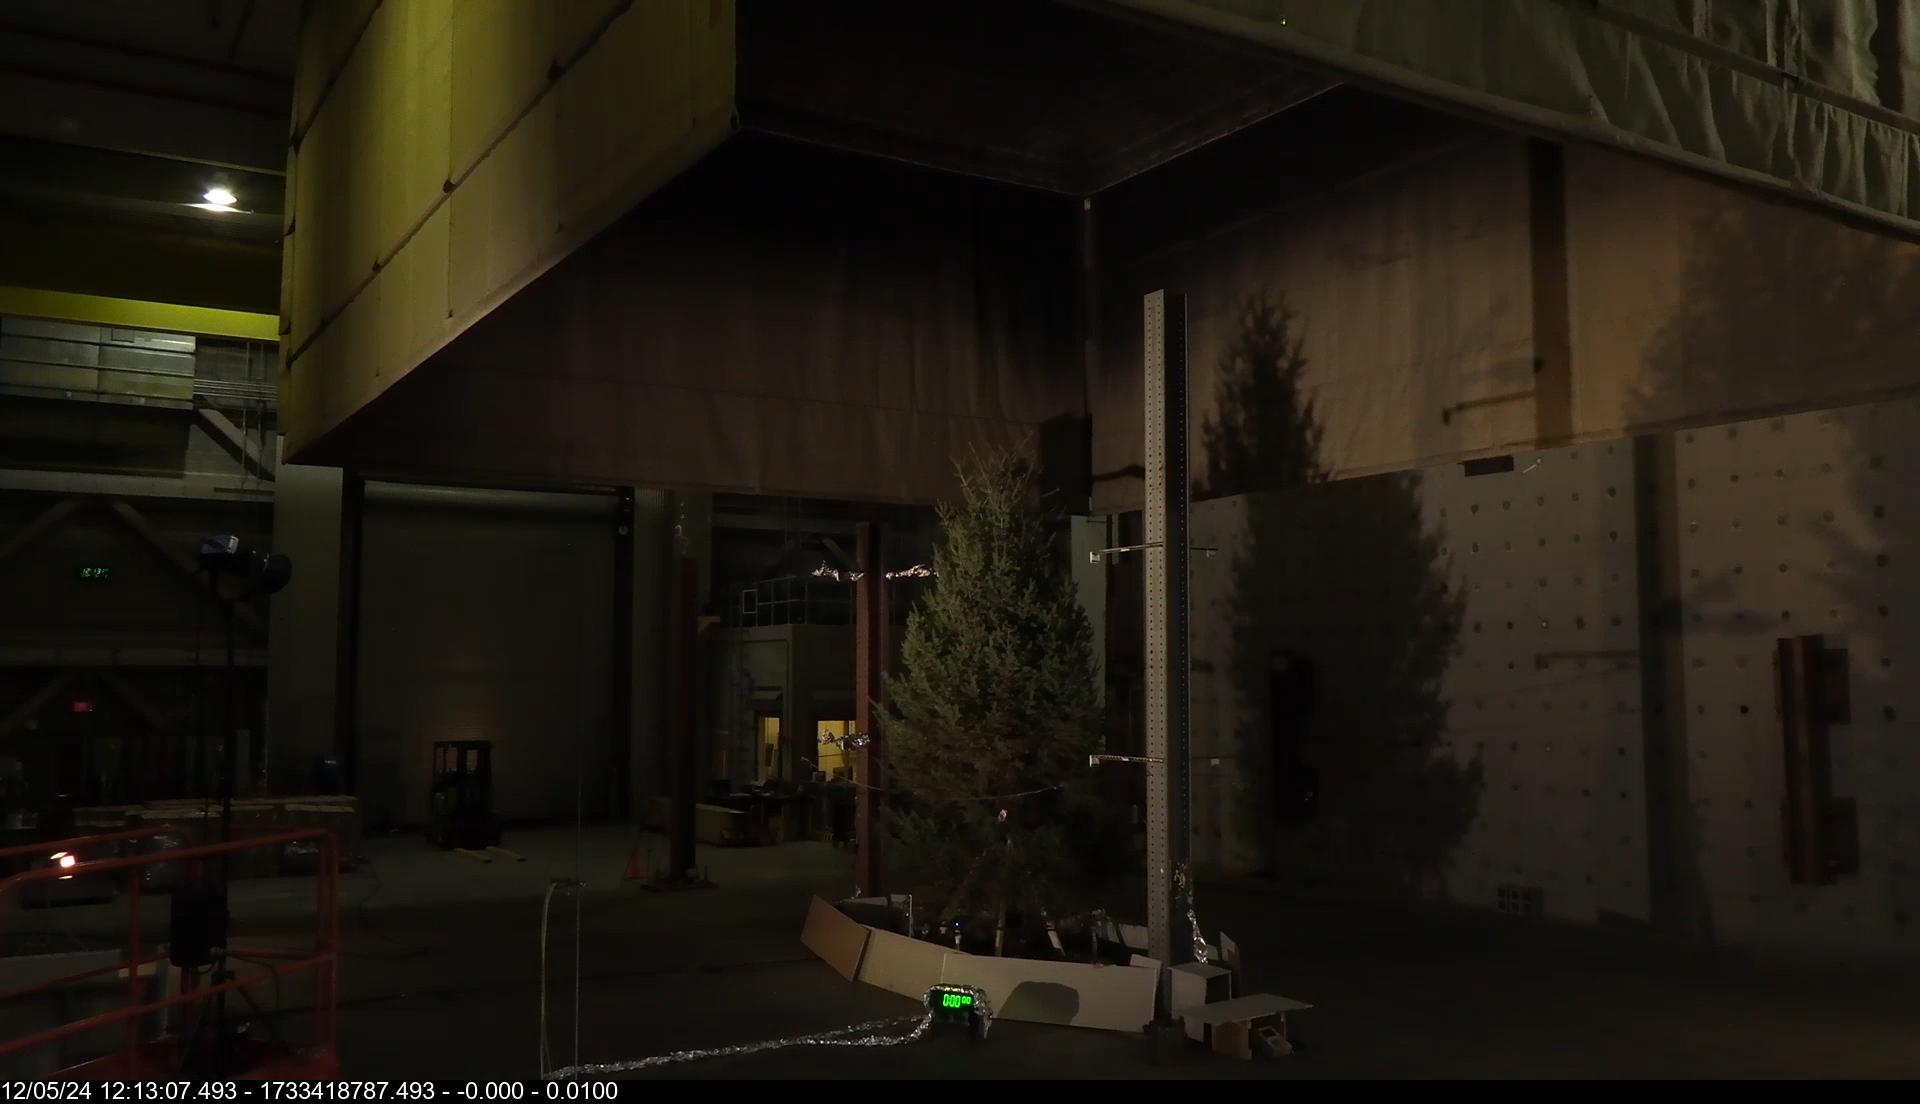
|
20 ft Douglas Fir Tree | Cellulose | 3.42
|
616
|
35,537
|
|
| Tree13 | 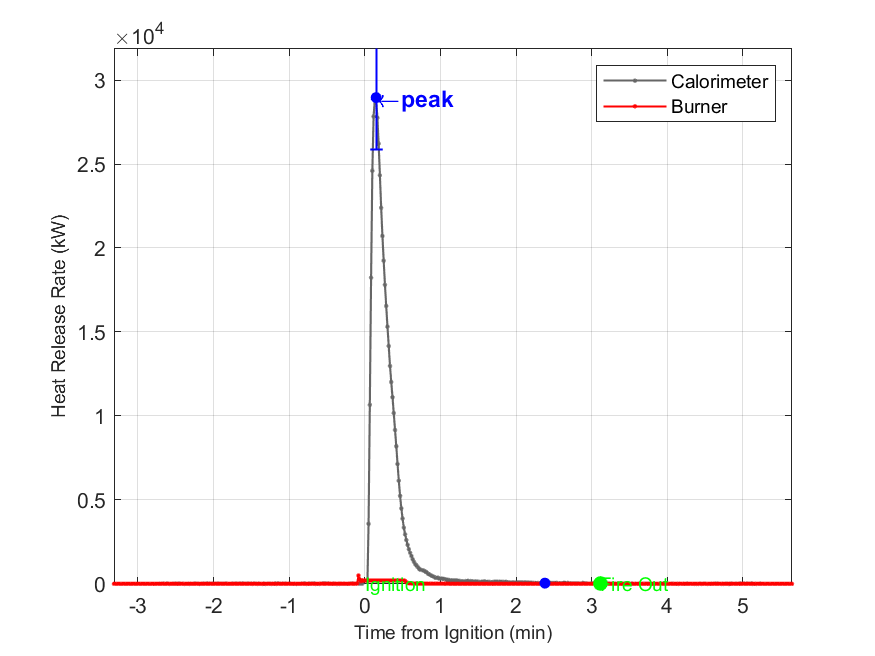
|
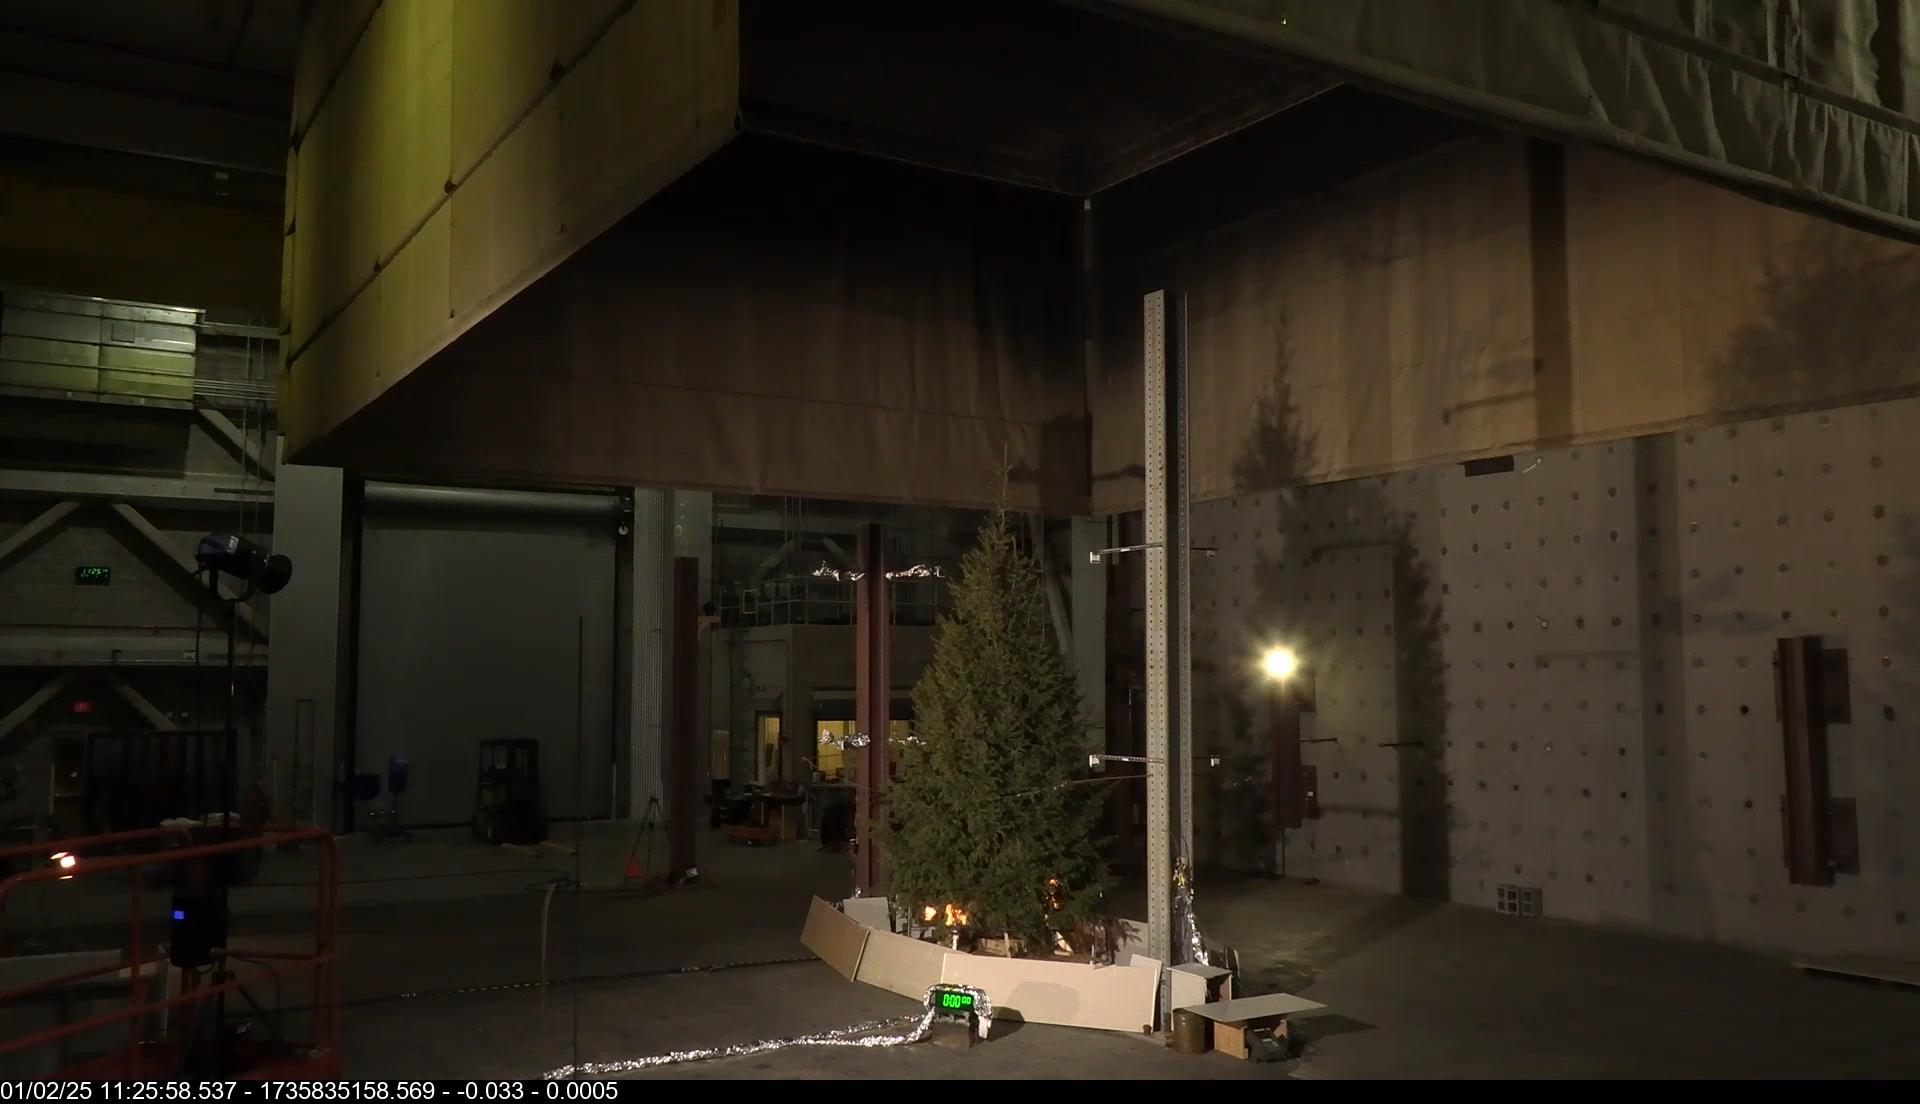
|
20 ft Douglas Fir Tree | Cellulose | 3.12
|
481
|
28,953
|
|
| Tree14 | 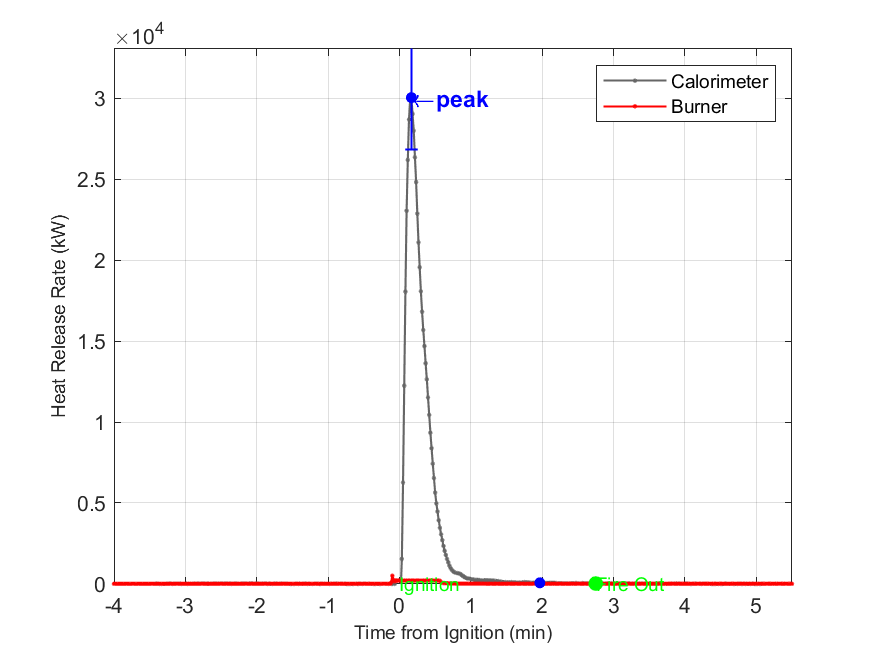
|
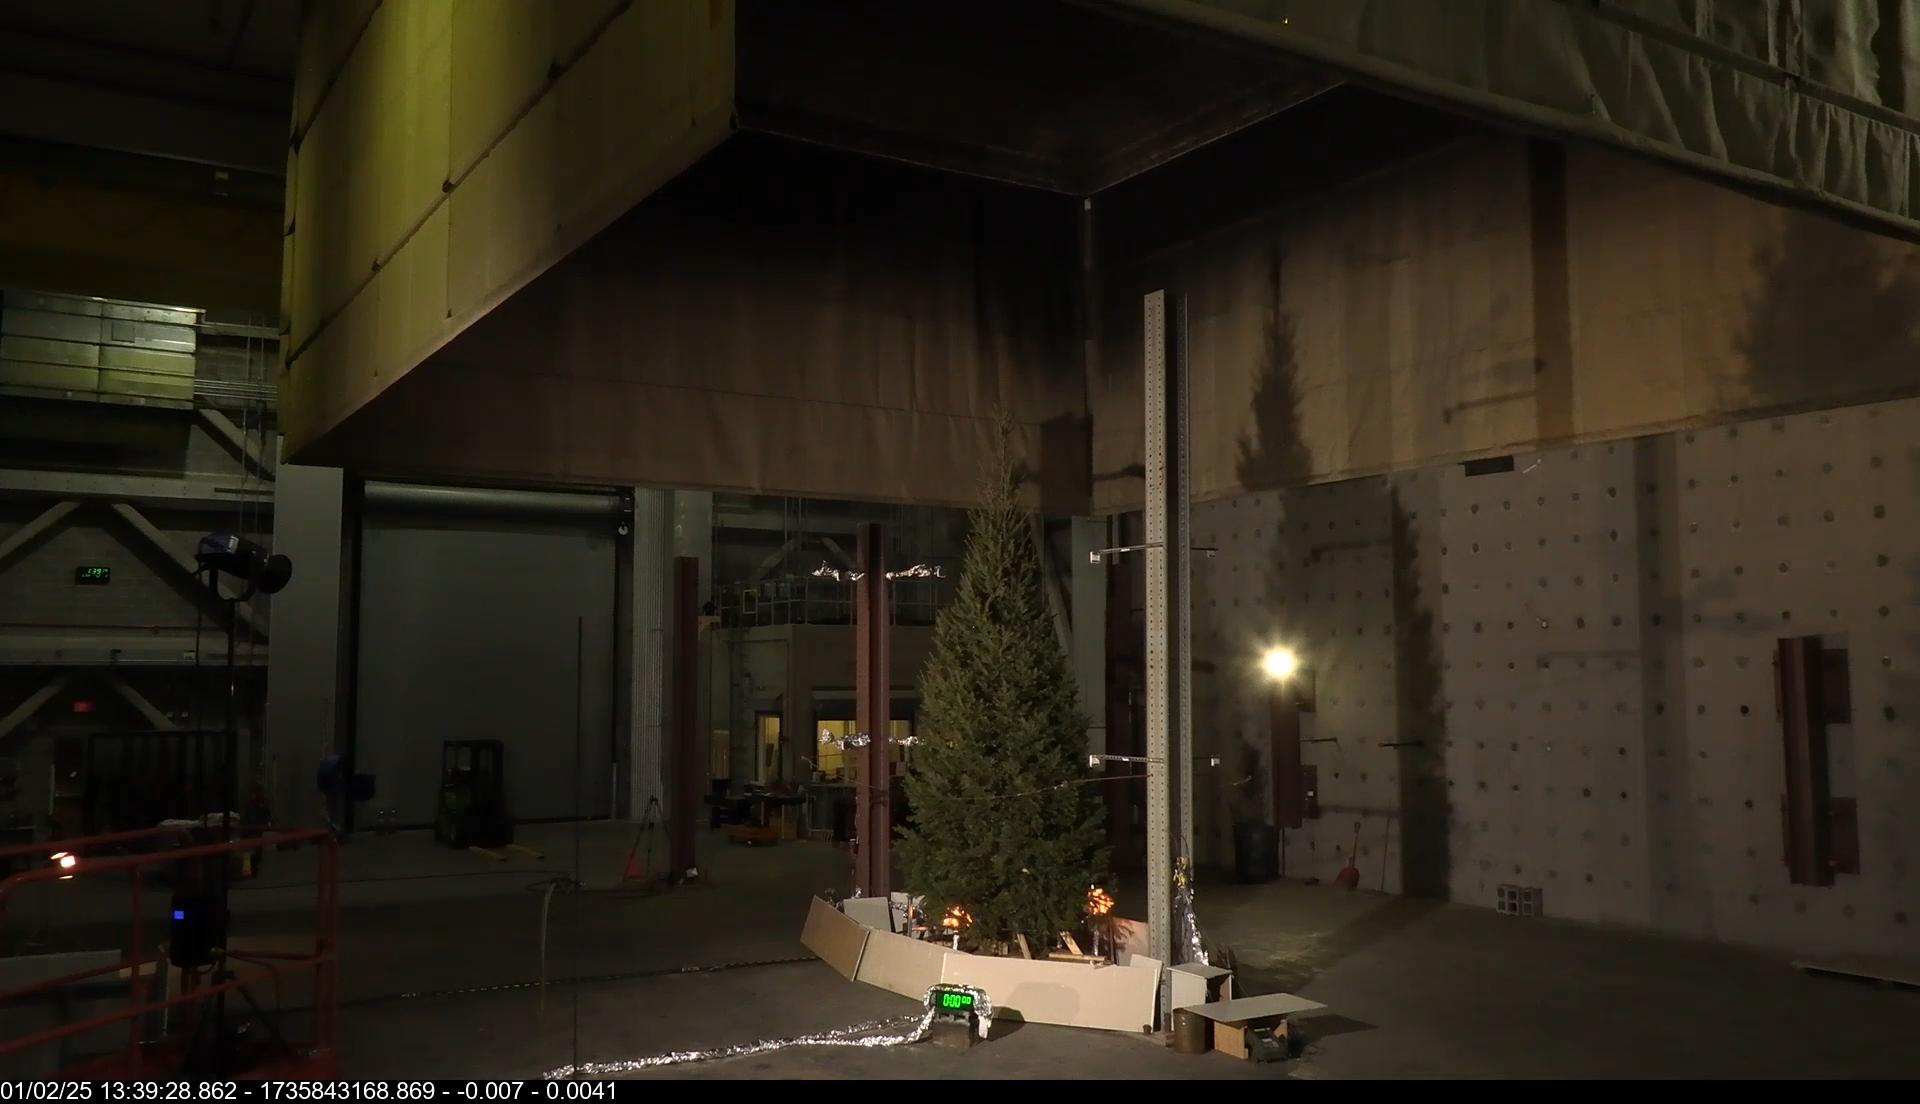
|
20 ft Douglas Fir Tree | Cellulose | 2.75
|
550
|
30,051
|
|
| Tree15 | 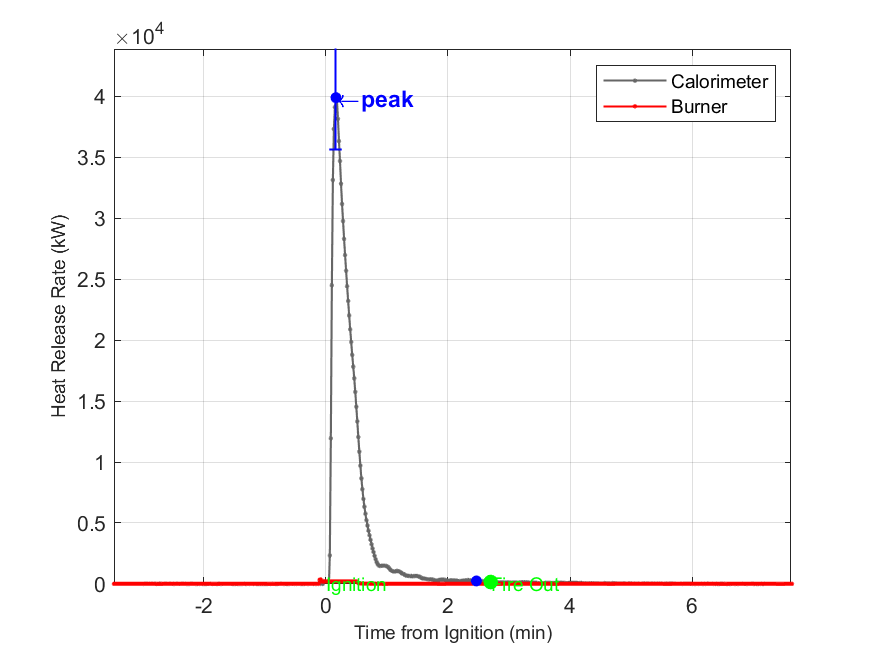
|
|
20 ft Douglas Fir Tree | Cellulose | 2.70
|
885
|
39,905
|
|
| Tree16 | 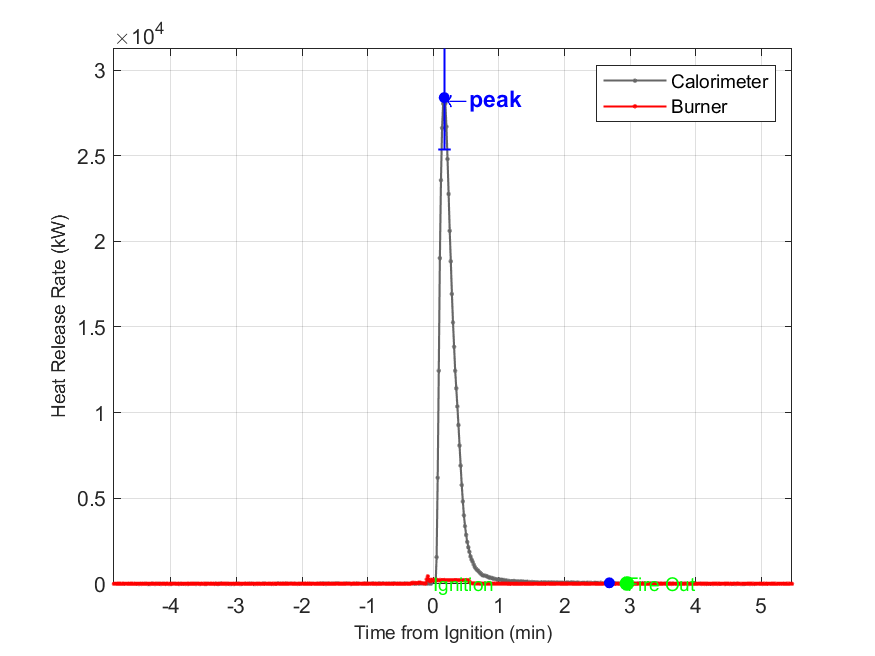
|
|
20 ft Douglas Fir Tree | Cellulose | 2.95
|
445
|
28,389
|
|
| Tree17 | 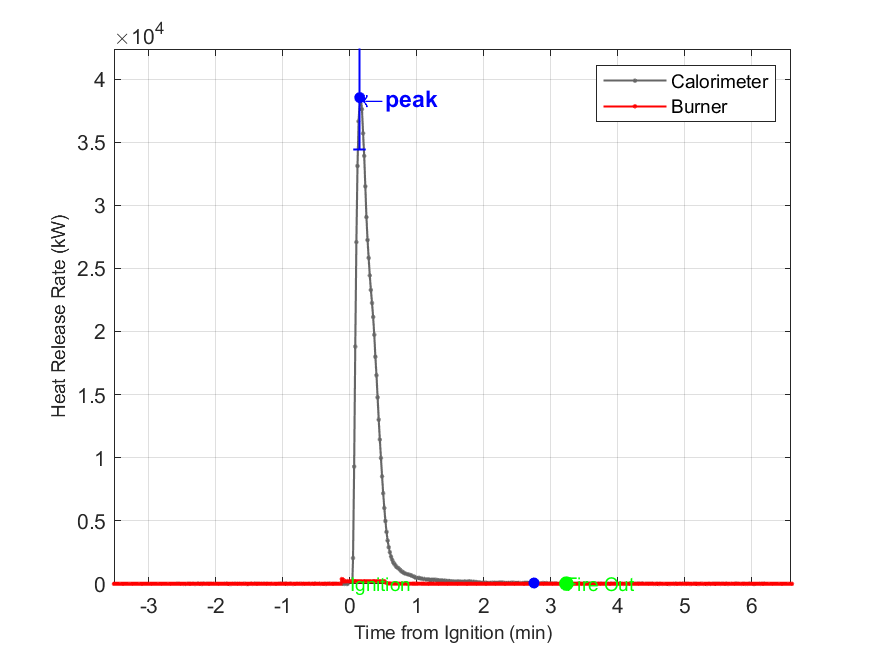
|
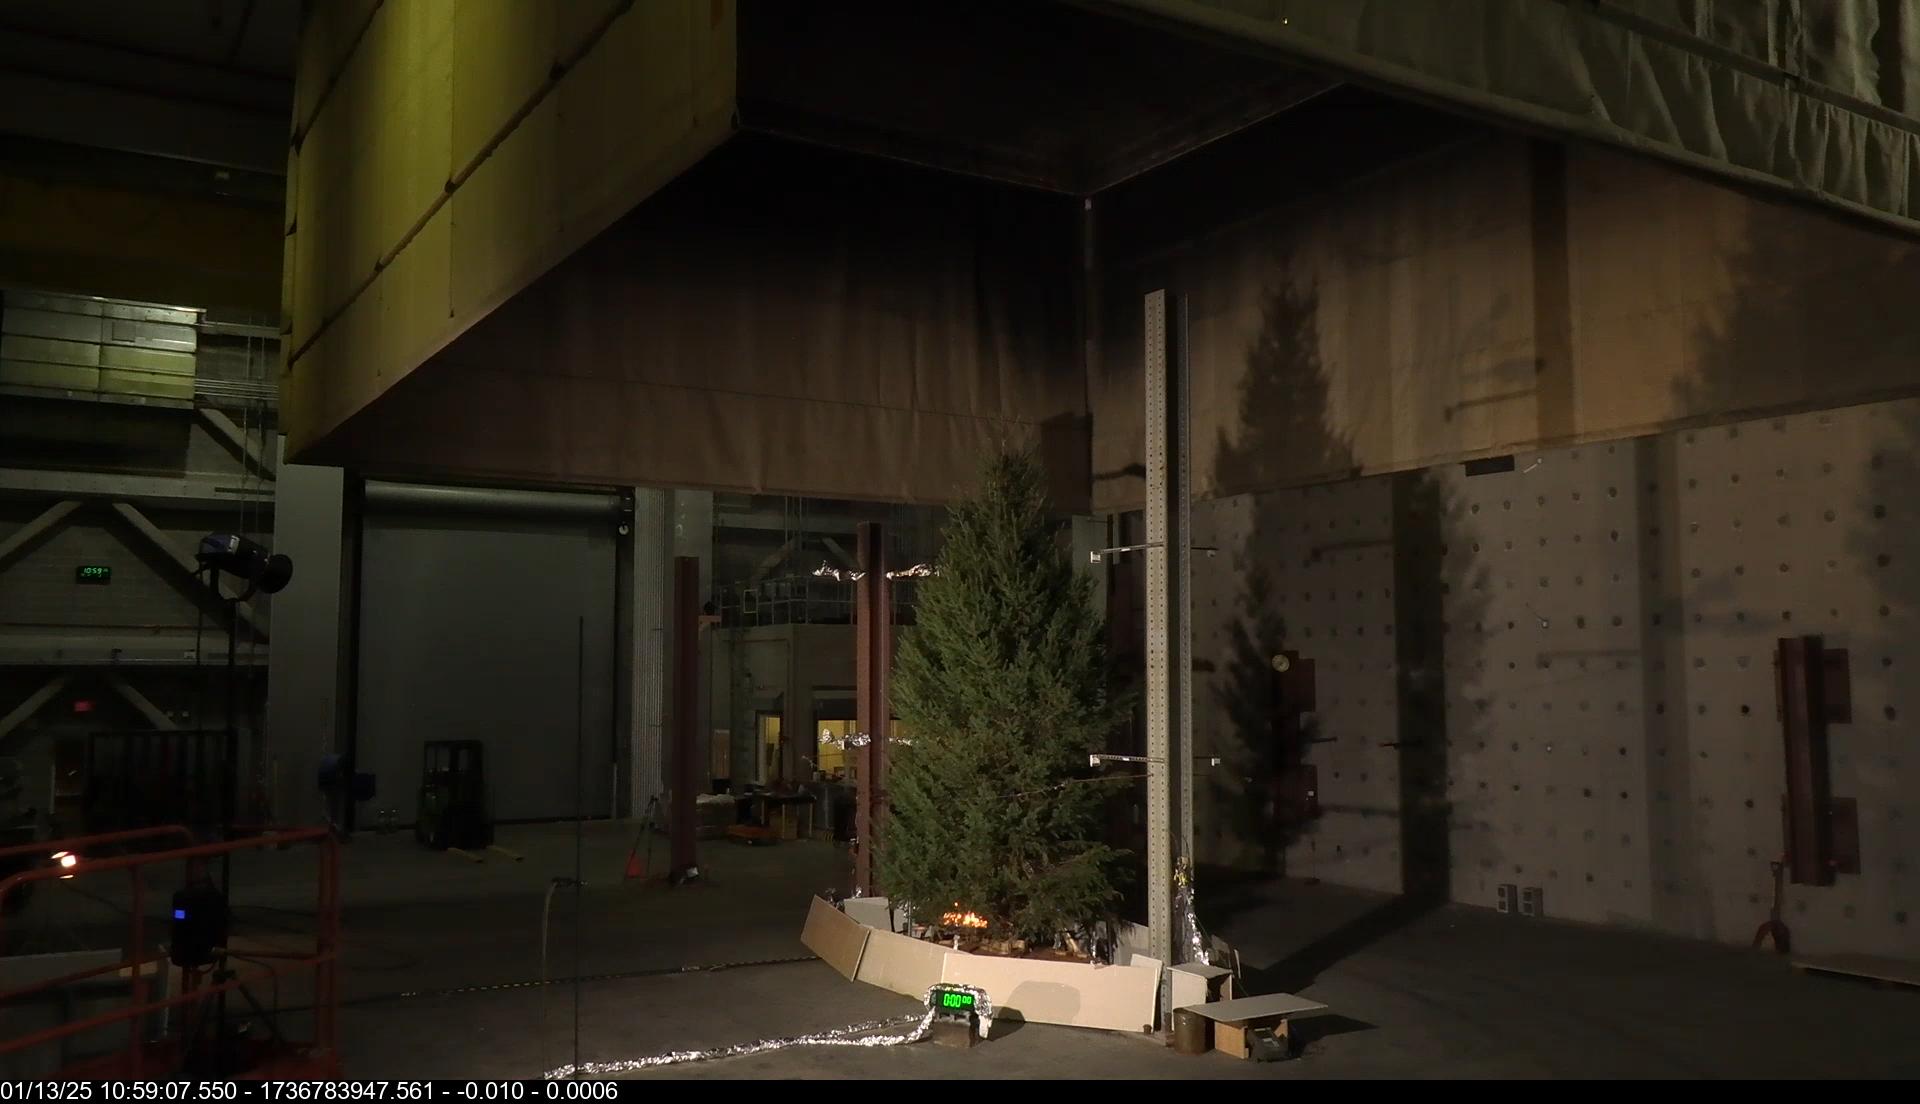
|
20 ft Douglas Fir Tree | Cellulose | 3.23
|
701
|
38,529
|
|
| Tree18 | 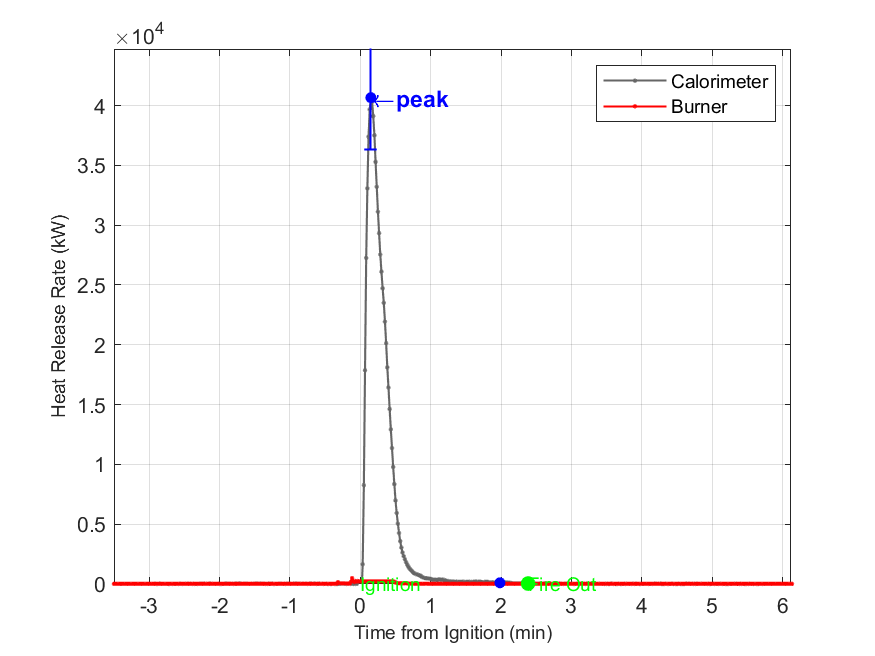
|
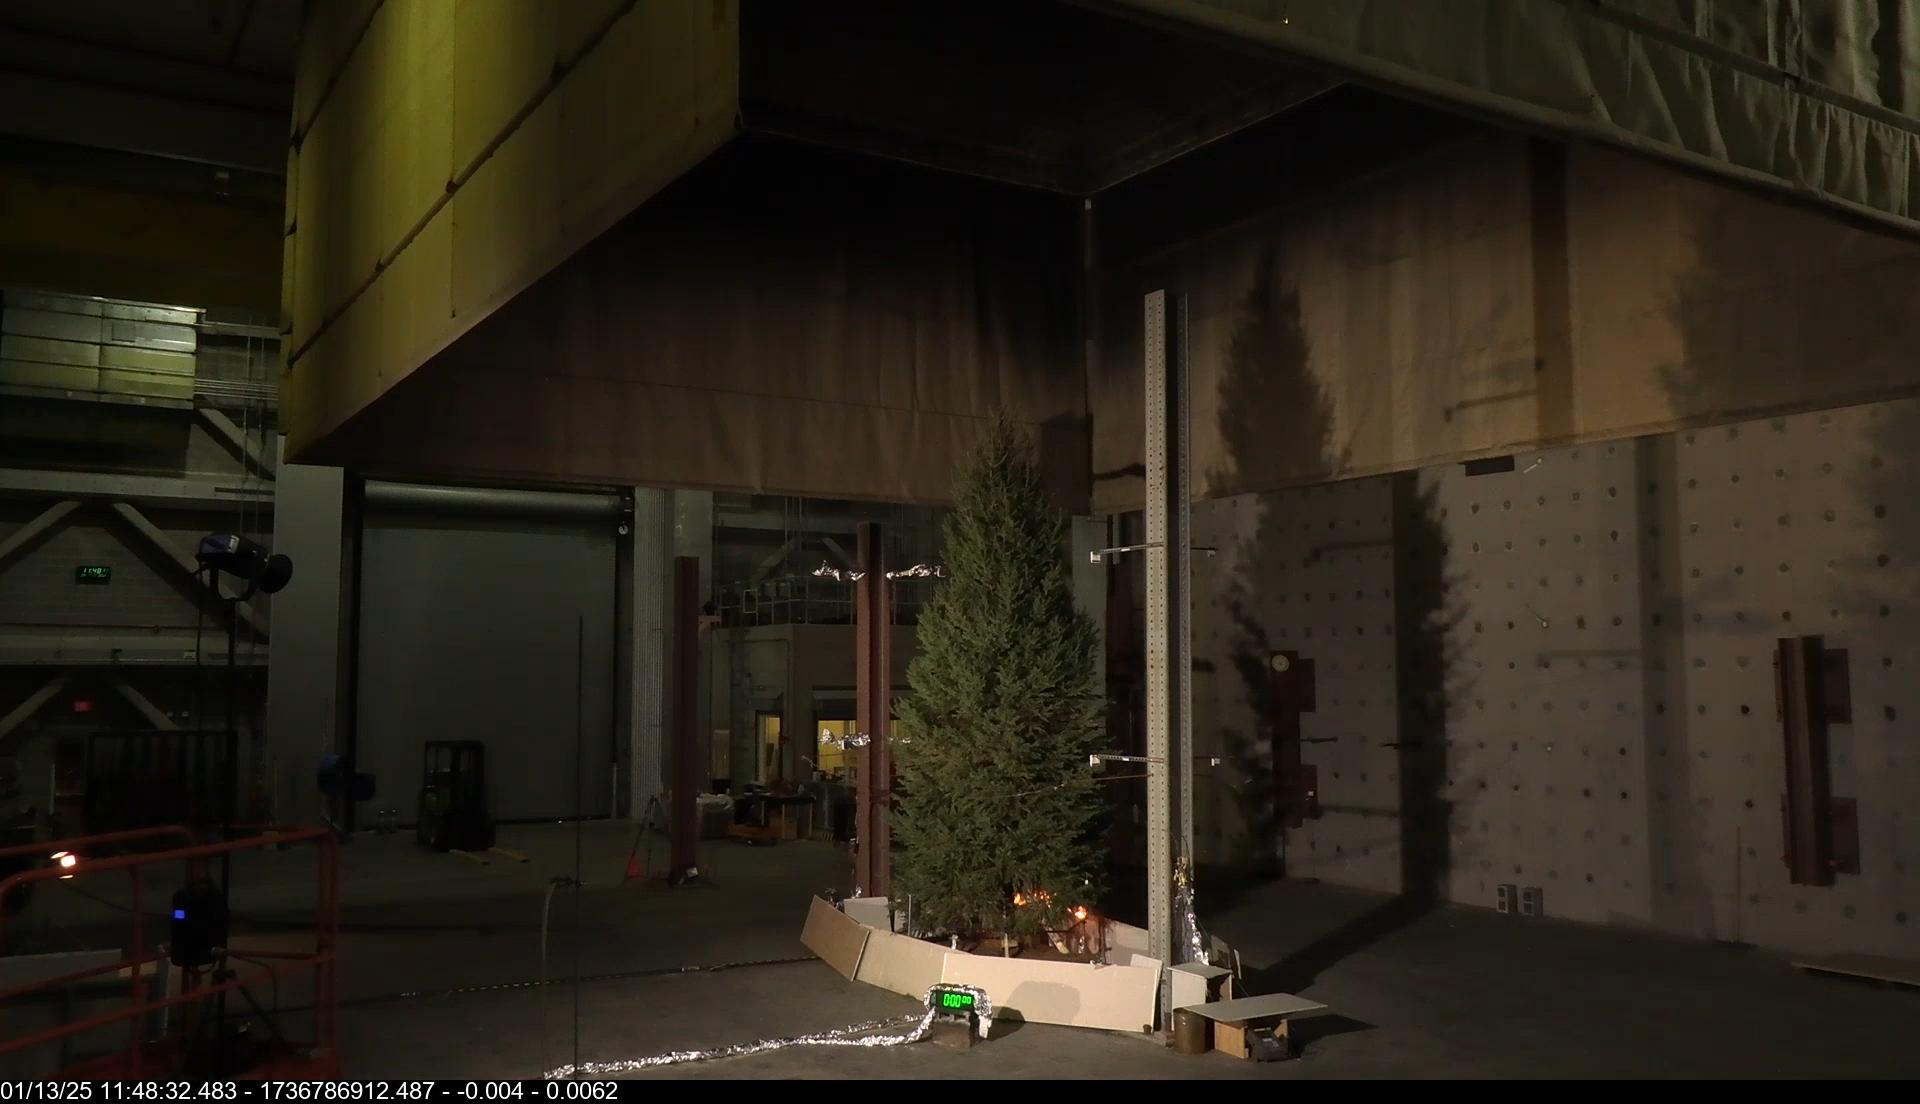
|
20 ft Douglas Fir Tree | Cellulose | 2.38
|
753
|
40,662
|
|
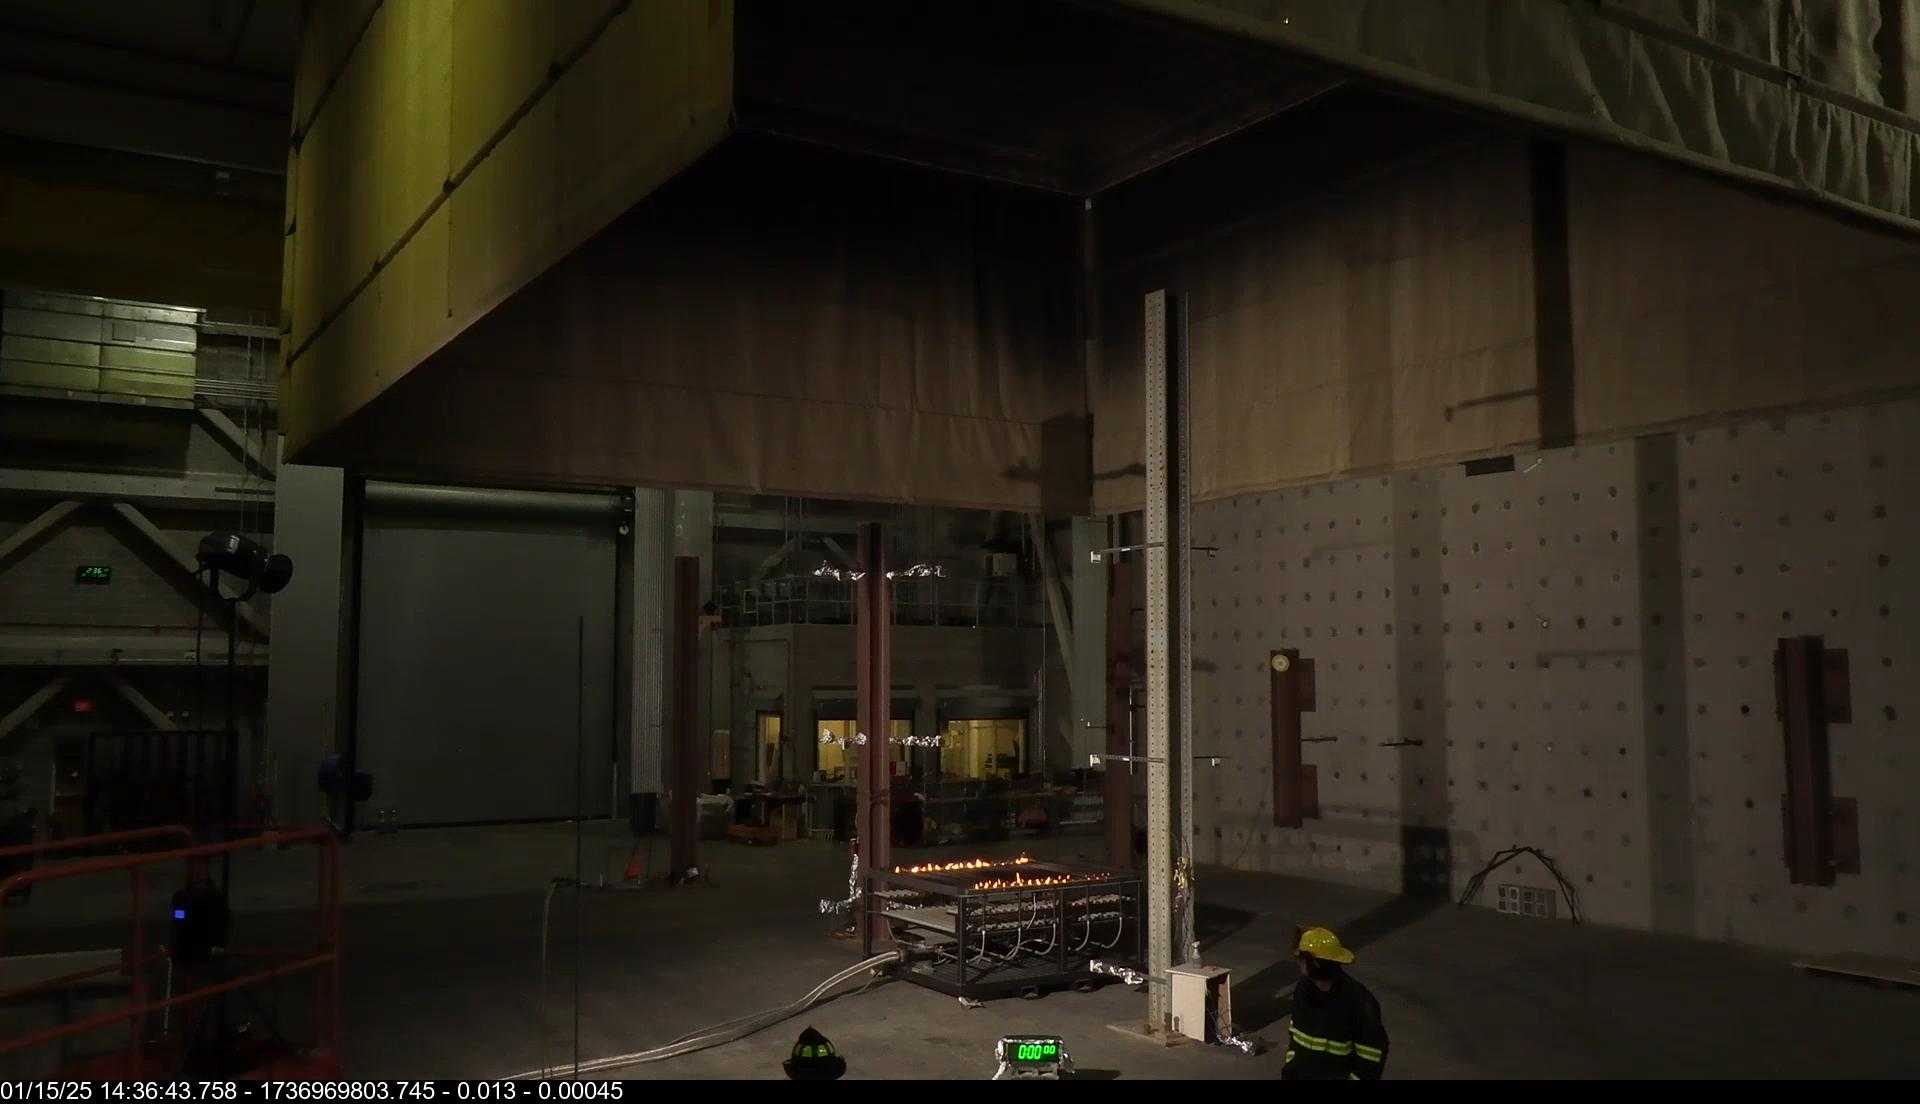
| NGQC_15m_50kgs_R3 | 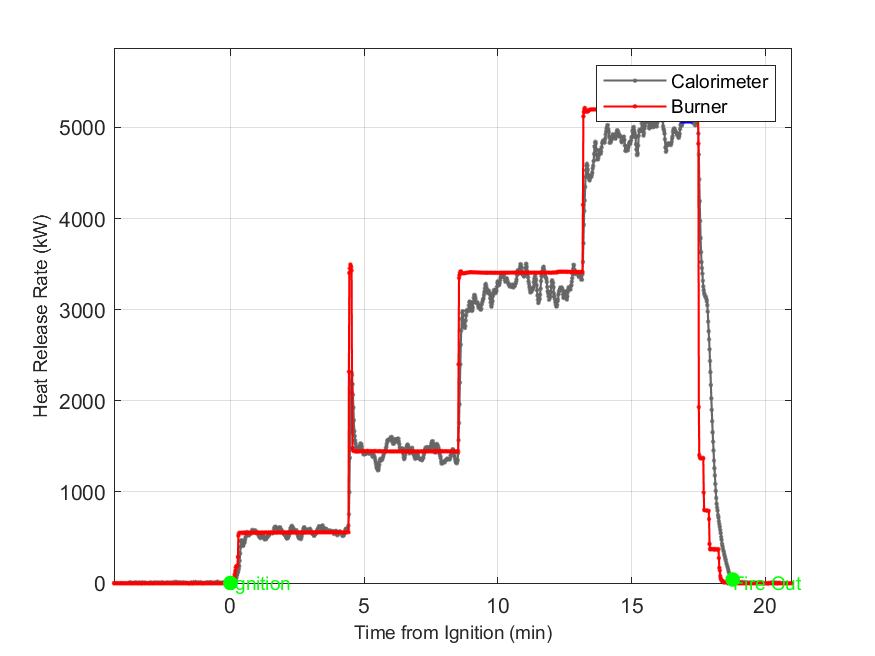
|
|
Tube Burner | Natural Gas | 18.78
|
2,783
|
5,327
|
|
| NGQC_15m_100kgs_R3 | 
|

|
Tube Burner | Natural Gas | 20.42
|
8,532
|
22,402
|
|
| NGQC_15m_100kgs_Pulse_R1 | 
|

|
Tube Burner | Natural Gas | 10.82
|
2,509
|
21,742
|
Bryant, R. and Bundy, M. The NIST 20 MW Calorimetry Measurement System for Large-Fire Research, Technical Note (NIST TN) 2077, 2019
https://doi.org/10.6028/NIST.TN.2077
NIST Fire Calorimetry Database (FCD)
https://doi.org/10.18434/mds2-2314