
Official websites use .gov
A .gov website belongs to an official government organization in the United States.
Secure .gov websites use HTTPS
A lock (
) or https:// means you’ve safely connected to the .gov website. Share sensitive information only on official, secure websites.
Quantum Locking Ranges
Visualization of Quantum Locking Ranges for the Programmable Josephson Voltage Standard (PJVS) and Josephson Arbitrary Waveform Synthesizer (JAWS)
The quantum behavior of Josephson junctions (JJs) derives from the phase difference between the macroscopic wavefunctions of the Bose-Einstein condensate of Cooper pairs on either side of the junction barrier. This phase difference is periodic in 2pi, and the time-dependent junction voltage is precisely equal to h/(4pie) times the rate of change of this phase difference, where e is the elementary charge and h is the Planck constant; both are defined constants in the International System of Units (SI). This relationship creates features unique to Josephson junctions: a junction produces a perfectly quantized voltage pulse with a time-integrated area of exactly h/2e for every 2pi change in phase difference. When a junction is current biased to a voltage V, its phase difference oscillates at a “Josephson” frequency fJ=(2e/h)V that is directly proportional to V. Thus, the junction generates an ac voltage (or current) at this frequency.
Josephson junctions are essentially current-biased voltage-tunable oscillators that can be entrained by or locked to an external microwave bias signal so that the junctions generate accurate voltages over a range of bias or operating conditions, including dc current, microwave power, and operating temperature. We call each of these ranges a “quantum-locking range” (QLR) of that operating parameter, provided that the phase difference across the junction changes by exactly an integer multiple of 2p while the junction precisely produces integer numbers of quantized voltage pulses for every period of the microwave bias signal [1,2].
- S. P. Benz, J. Biesecker, C. J. Burroughs, M. A. Castellanos-Beltran, P. D. Dresselhaus, N. E. Flowers-Jacobs, A. E. Fox, P. F. Hopkins, R. Johnson-Wilke, D. Olaya, A. Rüfenacht, A. J. Sirois, and J. Thomas, “AC Metrology Applications of the Josephson Effect,” Appl. Phys. Letts. Special Topic on Quantum Metrology, vol. 125, pp. 050501-6, July 18, 2024, DOI: 10.1063/5.0219991.
- A. Rüfenacht, N. E. Flowers-Jacobs, and S. P. Benz, "Impact of the New Generation of Josephson Voltage Standards in ac and dc Electric Metrology," Metrologia vol. 55, no. 5, pp. S152–S173, Aug 24, 2018 DOI: 10.1088/1681-7575/aad41a
A Josephson voltage standard (JVS) is operated within its quantum locking range (QLR) if the output voltage remains constant over a significant adjustable range around the step-centered bias parameters. When biased within the QLR (with n=±1), every JJ produces a single voltage pulse per input bias pulse. For the dc current bias parameter, the QLR defines the current range of the constant voltage step.
A JVS can be in one of two states: either it is operated within a well-characterized QLR, and the output voltage generated by the JJ array is precisely known; or it does not have a QLR, and the output voltage is undefined. In the second case, the JVS cannot serve as a metrology reference. Measuring only the stability of the generated voltage over a long period of time, possibly with low uncertainty, is not a sufficient criterion to test the quantum accuracy of the voltage standard; it simply tests the stability of the system biases and the circuit environment. If biased slightly outside its QLR the output voltage may remain stable (and probably very close to the ideal value) but will provide an inaccurate voltage.
For maximum confidence in output voltage accuracy, all bias parameters of a JVS should be optimized so that the JVS operates with the largest QLRs achievable. Ideally, the output signal should be confirmed even while performing calibration measurements. Below, we show typical QLRs for four different circuits and systems, a Programmable Josephson Voltage Standard (PJVS) for DC voltages, a Josephson Arbitrary Waveform Generator (JAWS) for audio frequency ac voltages, an RF JAWS circuit for megahertz signals, and a Josephson Pulse Quantizer (JPG) while it controls a qubit.
- Programmable Josephson Voltage Standard (PJVS)
Below, we show three examples of quantum locking ranges while measuring the output voltage of the PJVS system, as functions of the dc bias or dither current through the array, the magnitude of the applied microwave power driving the circuit, and the operating temperature of the cryocooler cold stage in the cryostat.
Microwave bias and DC Current bias QLRs for PJVS at 10 V:
Two-dimensional quantum-locking range of a 10 V PJVS array with the subarrays biased at 10 V. The horizontal (x) axis is the dither current applied through all the subarrays, while the vertical ( y ) axis shows microwave power offset in dB relative to the initial (optimum) power. The white speckled area indicates the QLR where the output voltage remains constant. The measurement was performed on the 10 V range of an 8½-digit voltmeter. The video of the horizontal and vertical cursor position movement provides dynamic information about the value measured by the voltmeter. All voltages highlighted in red are outside the quantum locking range. The second part of the video shows the variation as a function of the temperature variation of the device in the vertical (y) axis.
Microwave bias and DC Current bias QLRs for PJVS at 0 V:
Two-dimensional quantum-locking range of a 10 V PJVS array with the subarrays biased such that exactly the same number of junctions are at +5 V and −5 V, producing a null voltage. The horizontal (x) axis is the dither current applied through all the subarrays, while the vertical ( y ) axis shows microwave power offset in dB relative to the initial (optimum) power. The white area indicates the QLR where the output voltage remains constant. The measurement was performed on the 1 mV range of a digital nanovoltmeter. The video of the horizontal and vertical cursor position movement provides dynamic information about the value measured by the nanovoltmeter. All voltages highlighted in red are outside the quantum locking range. The second part of the video shows the variation as a function of the temperature variation of the device in the vertical (y) axis.
Operating Temperature and DC Current bias QLRs for PJVS at 10 V:
Two-dimensional quantum-locking range of a 10 V PJVS array with the subarrays biased at 10 V. The horizontal (x) axis is the dither current applied through all the subarrays, while the vertical ( y ) axis shows the temperature offset in kelvin relative to the initial 4.4 K temperature. The white speckled area indicates the QLR where the output voltage remains constant. The measurement was performed on the 10 V range of an 8½-digit voltmeter. The video of the horizontal and vertical cursor position movement provides dynamic information about the value measured by the voltmeter. All voltages highlighted in red are outside the quantum locking range.
B. JAWS ac voltages
The Josephson junctions in JAWS circuits are driven by a sequence of current pulses; by controlling the density, timing, and polarity of the quantized pulses generated by the JJs, JAWS systems produce intrinsically accurate sine wave voltages. JAWS systems have been implemented for ac voltage metrology at “audio-range” frequencies below 20 kHz and rms voltages up to 4 V. The video in the figure below shows (a) the spectrum and (b) the QLR and total harmonic distortion (THD) results for the highest reported 4 V quantum-based synthesized signal.
Graphical visualization of the quantum locking range of a JAWS system generating a 1 kHz waveform with an rms magnitude of 2 V. In the graph, the color at each point indicates the voltage residual of a sine-wave fit as a function of dither offset current (y axis) and waveform period (x axis). The data was digitized over 80 ms with a National Instruments PXI-5922 digitizer (range 10 V, input impedance 1 MΩ, sampling rate 1 MHz). The blue lines show the 1.6 mA quantum locking range of this waveform and system, that is, where the residuals are limited by digitizer distortion and do not depend on offset current over the entire waveform period. The video presents the evolution of the quantum locking range (left), frequency spectrum (upper right), and total harmonic distortion (THD) as a function of the pulse amplitude (highlighted with the red dot). This visualization technique highlights the pulse sequences (e.g. at 0.25, 0.6, and 0.9 parts of a period) that limit the QLR and the sensitivity to pulse amplitude variation.
C. Radio Frequency (RF) JAWS
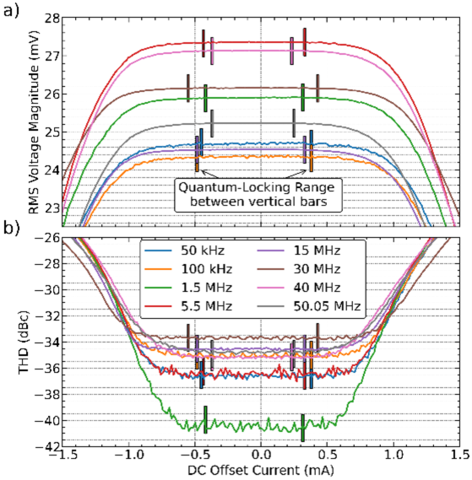
JAWS can also generate quantum-based RF signals, with the QLR still providing a reliable nonlinear signature of correct operation. The Figure below shows JAWS signals up to 50.05 MHz (VHF band), where a 1 mA dc offset QLR is indicated with vertical bars; linear transmission losses set the fraction of the 50-mV open-circuit voltage reaching a room-temperature digitizer [3]. The linear, programmable magnitude of these signals has been used to measure the nonlinearity and harmonic distortion of VHF digitizers and power sensors [4].
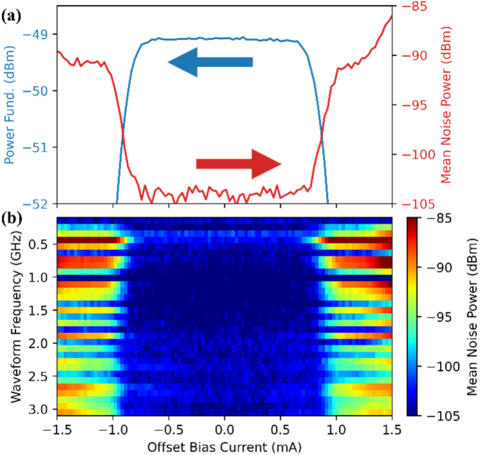
At microwave frequencies, where the THD is impractical for determining QLR with a bandpass delta-sigma algorithm, we instead monitor waveform magnitude and integrated in-band noise [5, 6]. Missing or extra junction pulses raise in-band noise, marking QLR limits. The Figure below shows 2 mA dc offset QLRs for single-tone waveforms up to 3 GHz; power at the fundamental is provided for the 500 MHz tone. S-parameter calibration has been used to correct for transmission loss, with agreement to 0.1 dB against LSNA calibrations below 500 MHz [5]. Beyond single tones, JAWS has also been used to generated multi-tone waveforms, including a 101-tone signal across 40 MHz and a 10 MHz QPSK waveform on a 1.005 GHz carrier [6].
- J. N. Thomas, N. E. Flowers-Jacobs, A. E. Fox, et al., "VHF Josephson Arbitrary Waveform Synthesizer," in IEEE Transactions on Applied Superconductivity, vol. 34, no. 7, pp. 1-10, Oct. 2024, Art no. 1500810, doi: 10.1109/TASC.2024.3418332.
- J. N. Thomas, N. E. Flowers-Jacobs, A. E. Fox, et al., "Measuring VHF Detector Linearity using a Quantum-Based Source," 2024 Conf. Prec. Elect. Meas. (CPEM), Denver, CO, USA, 2024, pp. 1-2, doi: 10.1109/CPEM61406.2024.10646166.
- N. E. Flowers-Jacobs, J. A. Brevik, A. A. Babenko, et al., "RF Josephson Arbitrary Waveform Synthesizer up to 3 GHz," 2022 Conf. Prec. Elect. Meas. (CPEM), Wellington, NZ, 2022, in publication
- A. A. Babenko, N. E. Flowers-Jacobs, A. E. Fox, et al., "Quantum-Based Modulated Microwave Waveforms," IEEE Trans. Microw. Theory Techn., vol. 72, no. 4, pp. 2047-2056, April 2024, doi: 10.1109/TMTT.2023.3297364
D. A Josephson Pulse Generator Controlling a Transmon Qubit
Superconducting qubits can be more reproducibly controlled with the accurate quantized pulses of Josephson junctions [7]; however, series arrays of junctions are needed for practical signal levels. Superconducting Josephson pulse generator (JPG) circuits use arrays of 500 and 4650 junctions to produce many-fold larger magnitude pulses. JPGs provide accurate, reproducible signals without calibration, unlike room-temperature-generated signals, potentially enhancing superconducting quantum processor scalability [8, 9]. A Josephson pulse generator (JPG) circuit consists of an N-junction series array to produce quantized pulses with N-fold-higher amplitude.
The JPG differs from JAWS arrays by operating over broader temperature ranges and generating finite trains of periodic quantized N-fold-amplitude pulses rather than arbitrary analog waveforms. Thus, the train of pulses sent by the JPG is not periodic and does not correspond to delta-sigma codes. The number of junctions in the JPG array at 3 K ensures that a sufficient pulse amplitude reaches the qubit at 10 mK after passing through intermediate attenuating coaxial lines.
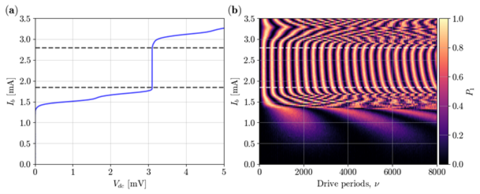
Our latest 500-JJ array device was validated by measuring the 0.9 mA QLR of the dc bias current (Ib) in the current-voltage curve [7], see Fig. (a) below. Digital control of the qubit and precise qubit state preparation were achieved with the JPG generating one N-fold-amplitude pulse per clock period. The exact number of sequential pulses sent to the qubit depended on parameters such as the coupling capacitance to the qubit and the total attenuation in the lines between the the 3 K and the 10 mK stages of the fridge. By adjusting the clock phase, the JPG performs arbitrary two-axes qubit rotations on the Bloch sphere [8,10].
- R. McDermott and M. G. Vavilov, Accurate Qubit Control with Single Flux Quantum Pulses, Phys. Rev. Appl. 2, 1 (2014).
- L. Howe, et al, Digital Control of a Superconducting Qubit Using a Josephson Pulse Generator at 3 K, PRX Quantum 3, 1 (2022).
- M. A. Castellanos-Beltran, et al, “Coherence-limited digital control of a superconducting qubit using a Josephson pulse generator at 3 K”, Appl. Phys. Lett., vol. 122, pp. 192602-6, May 8, 2023.
- E. Leonard, et al, Digital Coherent Control of a Superconducting Qubit, Phys. Rev. Appl. 11, 1 (2019).
Contacts
-
(303) 497-5258