
Official websites use .gov
A .gov website belongs to an official government organization in the United States.
Secure .gov websites use HTTPS
A lock (
) or https:// means you’ve safely connected to the .gov website. Share sensitive information only on official, secure websites.
X-Ray Computed Microtomography
Summary
Seeing inside a material object, in three dimensions, is often crucial for proper characterization, so that the link between microstructure and properties can be made. X-ray computed micro-tomography (the “micro” distinguishes it from medical X-ray tomography) or XCT, is well-suited to this task over a wide range of length scales and materials. The XCT takes a normal X-ray projection of an object, just like the X-ray pictures made of your teeth in the dentist’s office, but then the sample is rotated through many small angular increments and hundreds or thousands of such projections are made. A number of sophisticated algorithms can be used to put these many projections together to reconstruct what the interior of the object looks like. The two instruments that are operated by the Applied Chemicals and Materials Division are used to image pores that act as defects in additively manufactured metals, the cell size and geometry of cells in polymeric foams, and the fiber structure in carbon-fiber reinforced plastics. Probably the most-common use of the instruments is to determine the three-dimensional shape of a very wide range of powdered materials, from sand and rock dust to metallic powder for additive manufacturing to lunar soil gathered by the Apollo missions.
Description
Impact
XCT gives information that cannot be obtained any other way from opaque materials and objects. It gives us an “eye inside” so that features, of a certain size range, can be seen. The Division’s XCT instruments can reconstruct 3D images with a voxel size down to about 0.5 micrometers, at the smallest, and about 50 micrometers, at the largest. The typical size of the reconstructed images are 1000 x 1000 pixels for each cross-sectional slice, and usually at least 1000 and usually more slices. Many problems have detail on these length scales, and so analysis of materials properties is aided by these kinds of interior images. For example, when investigating the metallic powders used in laser-melting additive manufacturing instruments, one can see the small pores contained inside some of the metallic powder particles, which can possibly be transferred to the finished product, built by the additive manufacturing process, as mechanical defects.
Approach
XCT sample preparation is usually quite simple. One takes a piece of whatever needs to be examined, stabilizes it mechanically on some kind of platform that can be gripped by a standard instrument holder, and then inserted in the machine. The mechanical stability is important because scans can take several hours or more, and the least movement, even only of micrometers in size, will badly blur the images that have voxel sizes of only micrometers themselves. For powders, usually they are dispersed in an epoxy and the mixture, while still fluid, is drawn into a small diameter plastic tube by a low-powered vacuum pump. After curing, the solid tube can then be easily inserted in the XCT and scanned and the particles picked out computationally. The voltage of the X-ray tube itself can be adjusted, depending on which instrument is used, from either 40 kV to 100 kV or 30 kV to 160 kV, which changes the penetrating power of the X-rays. The exposure times can also be adjusted, so that materials from 90 % porosity polymeric foams to 1 % porosity stainless steels can be interrogated. Using the XCT to scan a sample and reconstruct the sample interior is actually the easy part – the hard part is analyzing the masses of image data obtained.
Major Accomplishments
Three projects will be highlighted:
- A study of how random shape affects particle size measures of a random powder (crushed waste glass),
- A study of the pore structure of a polymeric foam and how the XCT images can be used as the basis for finite-element-based computations of mechanical properties
- An on-going study of the 3D shape of lunar soil.
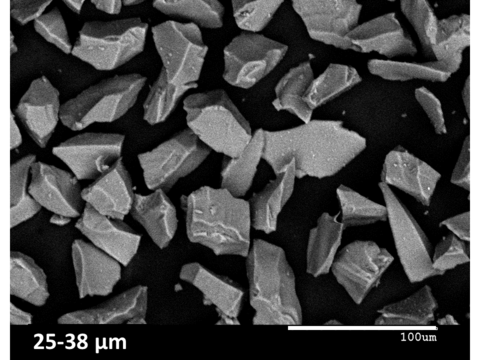
1. At least 10 million tons of waste glass is collected across the US every year, probably with much more going into landfills. If this waste glass is crushed to a fine powder, it can be recycled as new glass or as a component of composite materials such as concrete. The particle shape is important in itself for these applications. It is also an ideal test case for comparing the results of various particle size measurements, used widely across the US every day. Almost all of these measurements analyze a powder assuming its particles are spheres of various sizes; this is of course rarely the case. Crushed powder was prepared from a waste glass source and sieved to between 25 micrometers and 38 micrometers in “size” – sieve sizes are only loosely related to true particle size for non-spherical particles. Laser diffraction particle size measurements were also made on this powder size class. The XCT was used to scan this powder, giving the true 3D particle shapes for about 20 000 particles. The XCT data was used to explain the differences between the sieve analysis and the laser diffraction results.
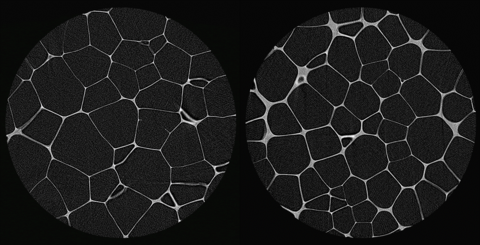
2. How the elastic properties of closed-cell foams, nominally made with the same base polymeric material, depend on variables such as total porosity and cell size distribution, was elucidated using large-scale elastic simulations acting on foam XCT images. The actual cross-sectional foam images were perfectly circular, because of the particular XCT technique used called “interior” tomography (see Figure 2). The circular boundaries are mathematically cut, not physically cut. A special finite element technique was developed that operated on the entire cylindrical 3D image (many circular images stacked together make a cylinder), so that no XCT data had to be thrown away. This project was able to show that different foams from the same manufacturer that were assumed to have identical materials making up their backbone instead had solid backbones that had quite different elastic properties. The study was also able to show how foam elastic properties depended on porosity and cell size, in agreement with experiment.
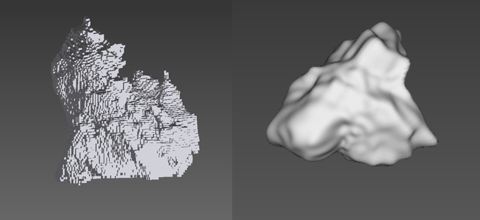
3. The particle shape analysis techniques using the XCT has now been turned towards analyzing the 3D shape of lunar soil particles, an on-going project. Under the instigation of a colleague from the NASA JPL laboratory, two 1-gram samples of lunar soil have been borrowed from the NASA CAPTEM program, one collected during the Apollo 11 mission (first man on the moon) and the Apollo 14 mission (first golf ball hit on the moon!). The idea behind this project is the following. Measuring the way sunlight scatters from the surface of airless objects in the solar system, including most especially the moon, is the best way, bar satellites in orbit or on the ground, of getting information about that surface. The scattering is studied as a function of angle and polarization and wavelength, but what has always been lacking is precise knowledge of what at the surface is doing the scattering – in the case of the moon, it is mainly lunar soil particles. This project is first to capture the 3D particle shape, then compute the light scattering that comes from those particular shapes. With this knowledge, one will be better able to interpret the sunlight scattering data in terms of a collection of random shapes, extracting more real information from the data about the lunar surface and, by analogy, other airless solar system surfaces.
Additional Technical Details
Selected Publications
Review of particle shape research:
E.J. Garboczi and J.W. Bullard, 3D analytical mathematical models of random star-shape particles via a combination of X-ray computed microtomography and spherical harmonic analysis, Advanced Powder Technology, in press (2017).
Crushed waste glass work:
E.J. Garboczi, K.A. Riding, and Mohammadreza Mirzahosseini, Particle shape effects on particle size measurement for crushed waste glass, Advanced Powder Technology, in press (2017).
Foam work:
K. Natesaiyer, C. Chan, S. Sinha-Ray, D. Song, C.L. Lin, J.D. Miller, E.J. Garboczi, and A. M. Forster, X-ray CT imaging and finite element computations of the elastic properties of a rigid organic foam compared to experimental measurements: Insights into foam variability, J. Mater. Sci. 50, 4012–4024 (2015). DOI 10.1007/s10853-015-8958-4.
E.J. Garboczi and V. Kushch, Computing elastic moduli on 3-D X-ray computed tomography image stacks, J. Mech. Phys. Solids 76, 84-97 (2015).
Lunar soil work:
http://nist-takingmeasure.blogs.govdelivery.com/mooning-over-measurement/