
Official websites use .gov
A .gov website belongs to an official government organization in the United States.
Secure .gov websites use HTTPS
A lock (
) or https:// means you’ve safely connected to the .gov website. Share sensitive information only on official, secure websites.
Performance of UTC(NIST) and UTC(NIST) Adjustments
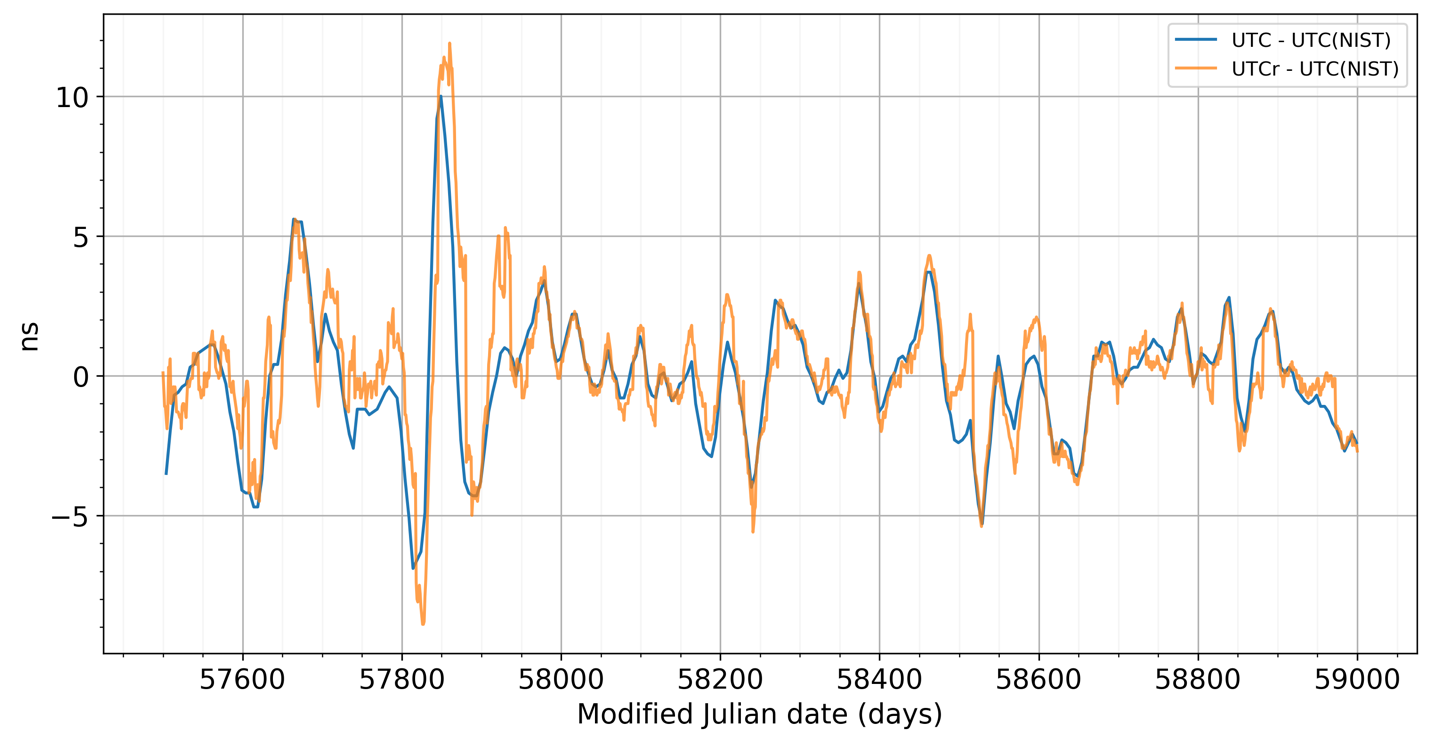
The BIPM publication Circular-T is the official record of UTC – UTC(NIST) time differences. Figure 11 is a graph of the four year period ending in February 2020, showing the UTCr – UTC(NIST) differences in addition to the UTC calculations. The graph indicates that the time difference between UTC and UTC(NIST) has seldom exceeded 5 ns during the past several years.
NIST scientists decide when to make adjustments to UTC(NIST). They do so by analyzing all of the scientific information they have available. This information includes BIPM data, direct comparisons with other national metrology institutes via two-way satellite time and frequency transfer or GPS carrier-phase observations, and local or remote comparisons with atomic frequency references. The NIST scientists meet weekly to decide what frequency offset ought to be applied between TA(NIST) and UTC(NIST). They attempt to satisfy two abstract goals: to reduce the absolute magnitude of the future time error UTC – UTC(NIST), and to preserve or improve the frequency stability of UTC(NIST). In general, due to the nature of clock noise and time transfer noise, both goals cannot be simultaneously achieved over all averaging intervals. Nonetheless, the NIST steering adjustments typically keep the root-mean-square deviation of UTC – UTC(NIST) to within < 3 ns, and the frequency instability of UTC(NIST) to below \( 2\ \times{10}^{-15} \). Over long averaging intervals, such as years, both deviation measures are much lower.
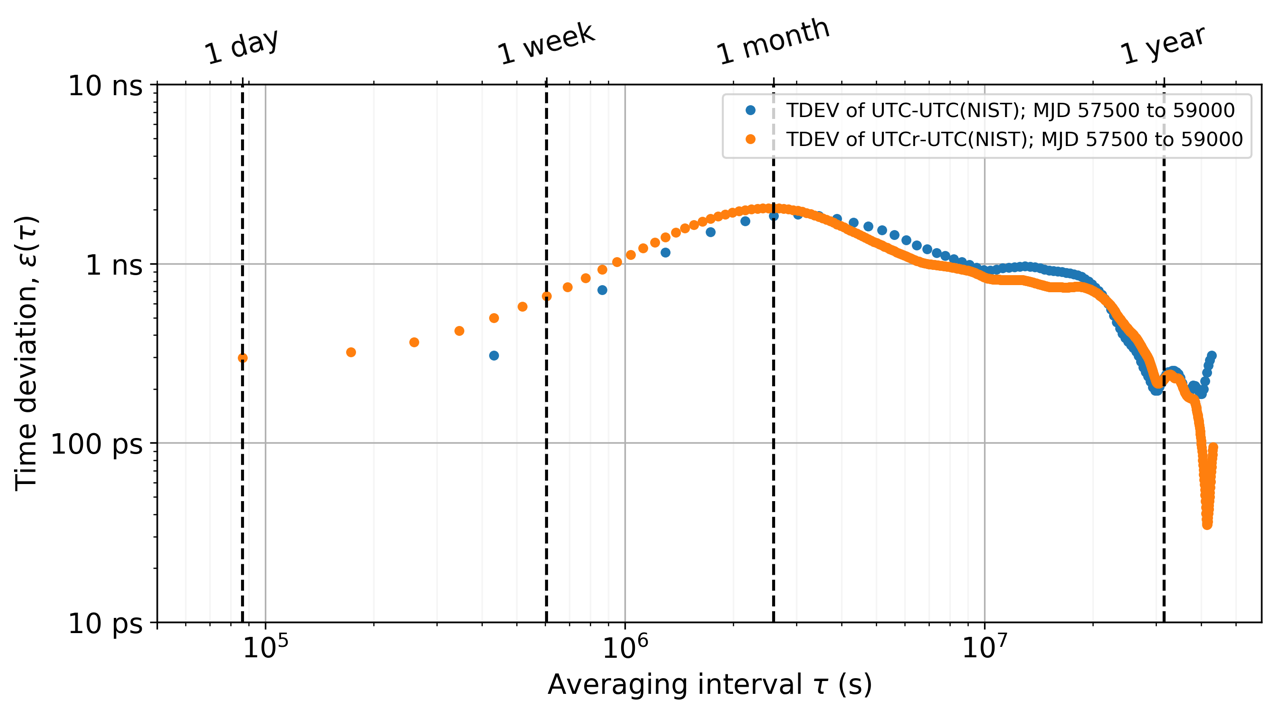
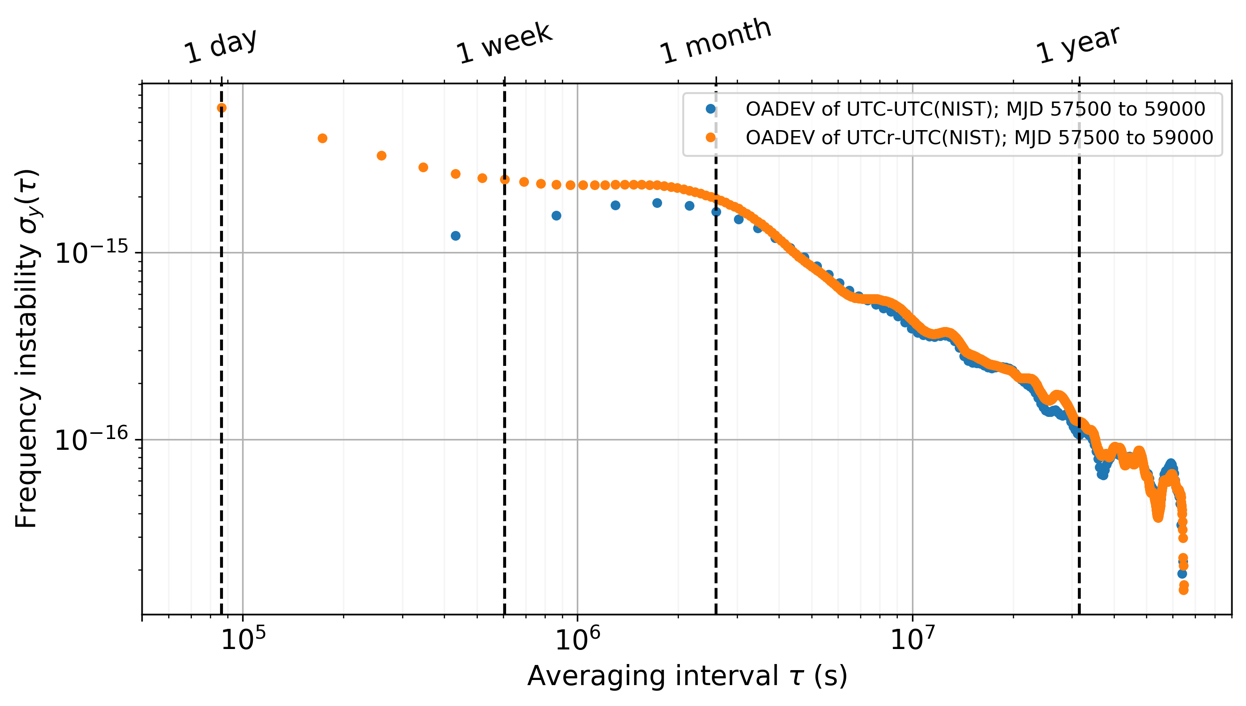
To illustrate this, Figures 12 and 13 show the time deviation (TDEV) statistic and overlapping Allan deviation (a measure of frequency instability) of these data, respectively. Both graphs show UTC and UTCr data. Over almost all averaging intervals, the mean variation of the UTC – UTC(NIST) time offset is held to 2 ns or less, and the UTC – UTC(NIST) frequency instability is \( \le2\ \times{10}^{-15} \). Over averaging intervals longer than 1 year, the rate instability of UTC – UTC(NIST) < 10-16, which is near the absolute uncertainty limits of the world’s best primary frequency references.
Contacts
Technical Contact
-
(303) 497-3511