
Official websites use .gov
A .gov website belongs to an official government organization in the United States.
Secure .gov websites use HTTPS
A lock (
) or https:// means you’ve safely connected to the .gov website. Share sensitive information only on official, secure websites.
Image Sampling and Segmentation Accuracy
Project Research Questions
- How many reference images do we need to estimate segmentation performance?
- Do some image features have similar distribution as the segmentation accuracy?
- What image features relate to which segmentation technique with regards to accuracy?
Project Research Challenges
- Wide variety of cell line, large image features space and numerous segmentation techniques makes it challenging to find the best map between features with similar distribution to the segmentation technique.
- Lack of comprehensive and diverse reference data set to test the validity of these theories.
Proposed here is a new strategy for estimating the number of cellular objects that should be manually segmented for evaluating the segmentation accuracy of an algorithm. The strategy proposes using some image features distributions that are similar to segmentation performance distribution to compute the sample size (image 1 below). The shapes of these distributions, leading to the determination of the number of estimated objects, are calculated from data collected from the entire image set. The uncertainty associated with the selection of number of objects to manually segment is estimated, as well as an error associated with a particular sample of cell images. The use of this strategy may reduce the effort and time required for generating a reference dataset for evaluating segmentation algorithm performance with images of biological cells. The usefulness of this methodology on a large and diverse data set is demonstrated, for which reference data is available.
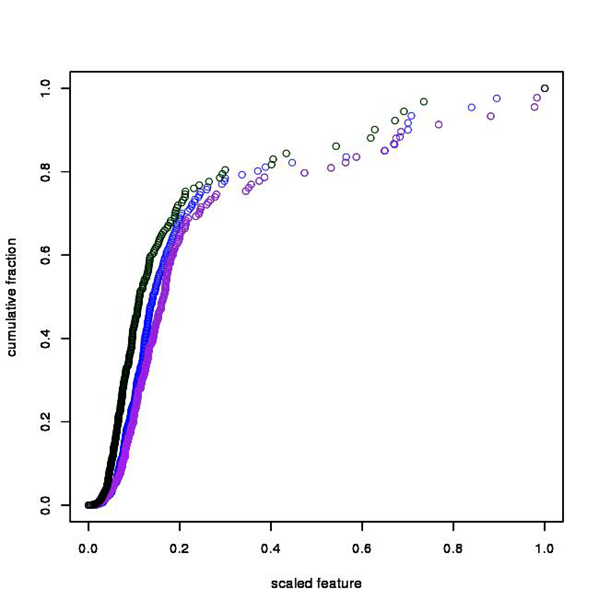
Plots of scaled cell feature (scaled 0.0 to 1.0): 5-kmeans segmentation accuracy measurements in black, EEN(Extended Edge Neighborhood) in blue, perimeter/area in purple.