
Official websites use .gov
A .gov website belongs to an official government organization in the United States.
Secure .gov websites use HTTPS
A lock (
) or https:// means you’ve safely connected to the .gov website. Share sensitive information only on official, secure websites.
Manufacturing Innovation Blog
Powered by the Manufacturing Extension Partnership

I’ve been on a long-term quest to convince folks that productivity is important and not just something economists are concerned about. I’ve written about productivity a couple of times over the years, so when an MEP center director recently asked me to assemble some information on productivity (or a proxy) across the states, I was up for the challenge.
I started out with the goal of just assembling the data, but I was fascinated by what it told me about different regions of the country. My research showed which states have more productive manufacturing sectors and how they stack up in comparison to one another in terms of productivity per employee. These insights could help MEP Centers develop ideas for helping their clients and states increase productivity.
I was able to find what I needed at the U.S. Bureau of Economic Analysis, in the data it publishes on GDP by industry, as well as wage and salary employment for each state. GDP by industry is a good proxy for productivity since it’s defined as gross output minus the cost of goods sold. For comparison purposes, we can call this proxy “manufacturing value added per employee” or “value added.” (If anyone wants the actual data, I would be happy to share the spreadsheet, kenneth.voytek [at] nist.gov (please contact me)).
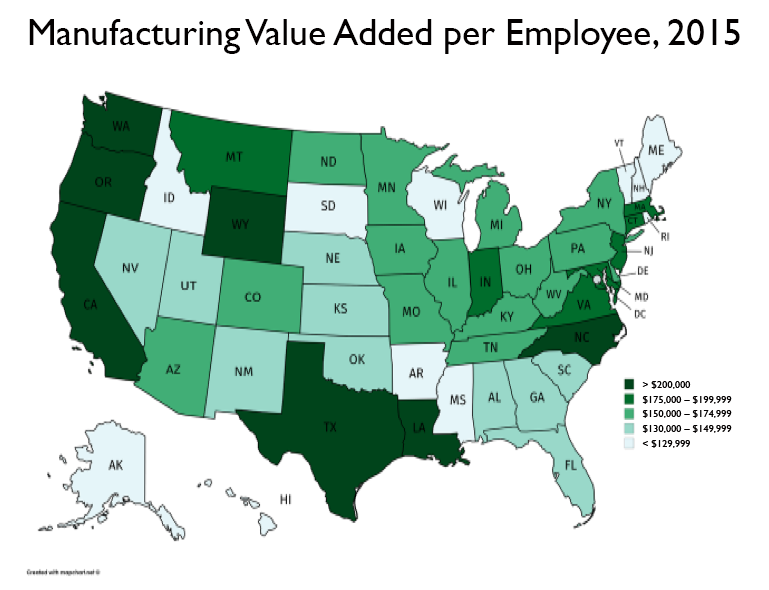
I was struck by the variability across the 50 states. Indeed, the variation was much higher than I would have expected. Manufacturing value added overall for the nation was $175,959 in 2015. Manufacturing value added per employee in 2015 (the most recent year in which both GDP by industry and employment are available) ranged from a low of just over $92,000 in Vermont to a high of nearly $355,000 in Louisiana. Value added per employee in Louisiana is nearly four times higher than it is in Vermont. I divided the states into five groups based on manufacturing value added per employee in 2015 and plotted them on the map below.
The darker the green shading, the higher the state’s manufacturing value added. From the map, you can see clusters of similarity between neighboring states. The states with the highest value added are along the East, West, and to some extent the Gulf coasts. There is also a cluster of states in the Southeast and New England that have the lowest value added. There are a handful of other states that stick out; for instance, Wyoming has a very high manufacturing value added per employee rate and Wisconsin has a much lower rating than most of its peer states in the Midwest.
So, what explains the differences? As Wilbur Thompson observed in 1965, “Tell me your industries and I will tell you your future,” and that applies as much today as when he wrote those words over 50 years ago. We know that value added varies dramatically across specific manufacturing industries, which will be a topic in my next post. The mix of industries in large measure explains the differences across the states. For instance, Texas, Louisiana, and Wyoming have significant shares of manufacturing employment in petroleum products and chemicals. Other industries with high value added include computer and electronics along with transportation equipment. This probably accounts for why states such as Oregon, North Carolina, Washington, and Maryland are among the highest in value added. In contrast, industries such as apparel, wood, furniture, and to some extent food, are industries with lower value added. These industries are concentrated throughout New England, which may explain the lower ratings in that region.
What does this mean beyond me showing off my cartography skills and ability to manipulate data? To me, it means a lot. First, this data serves as a north star for state economic and industry professionals, such as MEP Centers, to see if they can move the needle on these important stats in their state and serve as motivation to move up in the rankings.
Second, the data suggests ways that state and industry focused programing can begin to turn the tide. These include moving firms into new (and higher value added) markets, encouraging development of new and higher value added products, and thinking anew about how investments in things like technology and lean manufacturing can be used to improve productivity. Many of these drivers of productivity can be influenced not only by government policies, but also by companies.
The challenge remains: What can an organization’s managers, employees, and technical assistance providers do to improve performance? That’s the challenge and the opportunity.
About the author

Related Posts
Comments
- Reply