Official websites use .gov
A .gov website belongs to an official government organization in the United States.
Secure .gov websites use HTTPS
A lock (
) or https:// means you’ve safely connected to the .gov website. Share sensitive information only on official, secure websites.
Manufacturing Innovation Blog
Powered by the Manufacturing Extension Partnership

I am a baseball fan and just finished reading a new biography about Ty Cobb. I think he shares my bubbly and effervescent personality and anyone with the nickname the Georgia Peach has got my vote.
If Ty Cobb were alive today, I wonder what he would think about the current state of Georgia manufacturing. Every two years, the Georgia Tech Program in Science, Technology, and Innovation Policy (STIP) and Kennesaw State University survey manufacturers throughout Georgia. (MEP centers across the U.S. also conduct periodic surveys of their clients to help inform their work and the public about manufacturing and the issues they face.) The neat thing about the Georgia Tech survey is that they have been doing this survey since 1994. I think it’s useful to see what we know about manufacturing firms and these issues. The results are now available and provide a very interesting picture of what the manufacturing landscape (albeit limited to firms in Georgia) looks like.
The survey asked a range of questions focusing on how Georgia manufacturers deploy information technologies, management practices, and production technologies. The survey also looked at the benefits of different business strategies, the use of in- and out-sourcing, and talent development practices. Just over 500 manufacturers responded to the survey. Here are some of the interesting highlights:
- Nearly half of the manufacturers reported using some type of business assistance provider. The most common sources of business assistance came from universities and technical schools, state agencies, and private consultants.
- Manufacturers’ needs are diverse. Marketing and sales is the top concern among Georgia manufacturers in 2016. Finding employees with the right technical skills was the second most common need or problem. Improving manufacturing processes through lean manufacturing was the third most frequent need identified. Finding employees with the right basic skills was another significant issue. Each of these four problems/needs increased significantly from the 2014 survey.
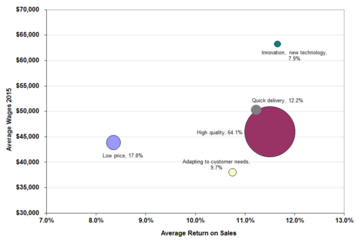
- Different business strategies lead to different bottom-line outcomes. The most important finding from the survey is that innovation has a bottom-line benefit for companies and their employees. The following chart suggests that firms adopting a strategy of innovation have higher profitability and pay higher wages compared to firms adopting other strategies. However, the difference in the returns to different strategies has narrowed over time.
Chart: Returns to Different Business Strategies
- Manufacturers are introducing new and improved products and services. Just over half of the respondents (51 percent) reported introducing a new or improved good or service within their establishment during the 2013-2015 period. Forty-five percent of the respondents reported introducing a new or significantly improved product and just under 15 percent reported introducing a new or improved service. These goods and services were split between two types: 27.6 percent were reported as being introduced before other competitors and 28.2 percent were new to their facility, but already available from competitors.
- New goods and services represented a modest portion of total sales. On average, 12.6 percent of total sales came from goods and services that were new to the market (the median was 10 percent) and sales from goods and services new to the firm, but not the market, represented about 19 percent of their total sales (the median was also 10 percent) based on new goods and services introduced over the last three years.
- Firms introduced a range of process innovations in addition to introducing new goods and services. Fifty-six percent of the respondents introduced a process innovation into their plant. Forty-four percent reported adopting new or improved production technologies and techniques, just under 13 percent introduced new or improved logistics, delivery, or distribution methods, and 23 percent reported other improvements including improvements in purchasing, accounting, or maintenance processes.
- Firms engaged in innovation activities focused on their organization. Nearly 60 percent of the firms responding improved their strategic planning, improved their internal management systems, restructured their organization, and their relationships with other firms. Twenty-two percent reported new or significant changes in corporate strategy while 24 percent implemented new or improved management systems. Just over one third of the respondents reported restructuring how work was organized (35.1 percent), and 23 percent reported changing their relationship with other firms including new alliances, partnerships, outsourcing, and subcontracting.
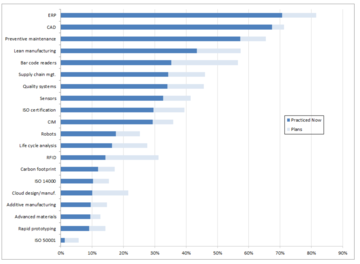
- Manufacturers deploy wide new manufacturing technologies and techniques. The survey asked respondents about their current or planned use of 19 manufacturing technologies and techniques. The table below shows increased deployment of these techniques compared to the 2014 survey. ERP software for scheduling and inventory control is used by seven in 10 respondents and computer aided design is used by 67%. Surprisingly, lean manufacturing, quality systems or adoption of various ISO standards were being used by less than half of the respondents.
Chart: Current and Planned Use of Various Technologies and Techniques
This data provides a look inside manufacturing firms and their activities. The survey focuses on areas including innovation, growth, and other issues including sustainability practices, workforce investments, and the adoption of new manufacturing processes and tools. It breaks the information down by firm size and industry. In fact, the aggregate results I reported above mask significant variation across industries and firm size. It is worth scanning the report to see how your firm stacks up or to see where things stand for a cross section of companies.
Whether these can be generalized beyond Georgia is difficult to say, but the results provide a potential benchmark and a survey tool to use by others. And if my favorite ballplayer were alive to see the manufacturing technology that his Georgia brethren are using 80 years after he was inducted into the baseball Hall of Fame, I think even crazy, disagreeable, gotta-always-be-first Cobb would approve.