
Official websites use .gov
A .gov website belongs to an official government organization in the United States.
Secure .gov websites use HTTPS
A lock (
) or https:// means you’ve safely connected to the .gov website. Share sensitive information only on official, secure websites.
Manufacturing Innovation Blog
Powered by the Manufacturing Extension Partnership

With advances in technology such as social media, innovative information systems, and sophisticated tracking systems, organizations are gathering information from places and interactions they never thought possible. But what do you do with all of this newly discovered data? Many times, organizations become overwhelmed and the gold mine of data goes unused. At NIST MEP, we are working to improve our use of data and foster a culture of data-driven decision making.
In an article published in early 2013 entitled “Data Science and its Relationship to Big Data and Data-Driven Decision Making,” Tom Fawcett and Foster Provost define data-driven decision making as “the practice of basing decisions on the analysis of data rather than purely intuition.”¹ The transition from basing decisions on experiences to basing decisions on data can directly improve productivity. Recent studies, such as that of Professor Erik Brynjolfsson of the MIT Sloan School of Management, show that data-driven decision making can increase productivity, output, and return on equity (ROE).²
So, what does this mean for the MEP system? We have access to a vast amount of data, coming from many different sources and we are working to provide our MEP Centers with more intelligence to identify the resources and tools manufacturers will need. Providing “data as a service” in this manner leverages the national office’s resources throughout the entire system, with the goal of helping centers gain a greater sense of the region and economy they work within. One specific example involves using spatial analysis through geographic information systems or “maps.”
Using geographic information system (GIS) to help analyze, visualize, and interpret data in order to recognize relationships, connections, and trends, MEP is able to take geographically specified data and turn it into a map, which can be broken into levels as detailed as zip codes and congressional districts, and as broad as groups of states or entire countries. The use of GIS has been successful on many fronts, including in the natural resources industry where it is used to visually analyze locations of sites related to oil and gas, petrochemicals, and mining. GIS has also been used to visualize demographic data, such as average household income, household size, age, and diversity.
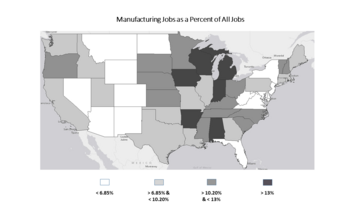
Within the context of the MEP system, GIS allows us to visualize market penetration, center economic impacts, industry clusters, and manufacturing establishments. We have used GIS to determine the distribution of manufacturing jobs throughout the country, defining what percentage of all jobs in each state are attributed to manufacturing.
The example below shows manufacturing jobs as a percentage of all jobs. The mapping tool allows users to color code states individually or by a grouping of their choosing. This tool was extremely useful in helping our system of centers and stakeholders visualize how important manufacturing jobs are to growth in their respective states.
The data types that can be used to map are extremely flexible as well. The information that we used to map the manufacturing jobs percentages came from Bureau of Labor Statistics (BLS) data. But, we have also mapped using our own internal data such as MEP clients and projects by industry, and even other government data such as the U.S. Census Bureau or private sector data.
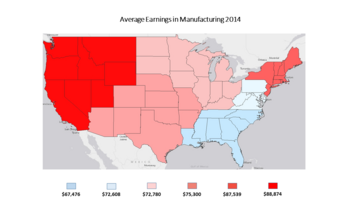
For example, Economic Modeling Specialists International (EMSI) combines labor force data from Census, BEA, and state sources through a propriety economic model to help understand the connection between the labor market and the economy. Using both GIS and EMSI, we have predicted what the 2014 average annual earnings will be for the manufacturing workforce in each of our six regions through the end of the year. The map below displays the average earnings per region, with the northwest region predicted to be the area where the manufacturing workforce earns the most, showing 2014 average earnings equaling $88,874, and the southeast region predicted to have the lowest average manufacturing workforce earnings at $67, 476.
Looking at data in the same old ways can often result in missing the story that the data is trying to tell us. Using spatial analysis available through mapping software helps paint the story. We are still in the initial stages of exploring the mapping capabilities and how we can use it to support the MEP system and the work of the centers. You can be sure we will be painting many pictures and highlighting the stories here.
1 Provost, F., & Fawcett, T. (2013). Data science and its relationship to big data and data-driven decision making. Big Data, 1(1), 51-59. doi: 10.1089/big.2013.1508
2 Brynjolfsson, E., Hitt, L., & Kim, H. (2011). Strength in numbers: How does data-driven decision making affect firm performance?. MIT Sloan School of Management
About the author

Related Posts
Comments
- Reply