Official websites use .gov
A .gov website belongs to an official government organization in the United States.
Secure .gov websites use HTTPS
A lock (
) or https:// means you’ve safely connected to the .gov website. Share sensitive information only on official, secure websites.
Manufacturing Innovation Blog
Powered by the Manufacturing Extension Partnership

Some recent data out of Georgia provides interesting insight into what is happening in manufacturing in the state. It’s relevant to us at MEP since our mission is to help increase the competitiveness and productivity of U.S. manufacturing. The network of MEP centers in each of the 50 states and Puerto Rico is focused on supporting manufacturers to increase their revenue, lower costs, adopt and deploy new technologies, develop new products, move into international markets, and improve their innovation capacity.
I think it useful to see what we know about manufacturing firms and these issues. Researchers at Georgia Tech and Kennesaw State provide one of the better pictures of what the manufacturing landscape (albeit limited to firms in Georgia) looks like in their 2014 Georgia Manufacturing Survey.
The survey, done every two years, asked a range of questions focusing on how Georgia manufacturers deploy information technologies, management practices, and production technologies. The survey also looked at the benefits of different business strategies, the use of in- and out-sourcing, and talent development practices. Just over 500 manufacturers responded to the survey. Here are some of the interesting highlights:
• Nearly 6 in 10 manufacturers reported receiving no outside assistance. The most common sources of business assistance came from universities and technical schools, state agencies, and private consultants.
• Manufacturers' needs are diverse. Marketing and sales is the top concern among Georgia manufacturers in 2014. Lean manufacturing was the second most common need or problem. Finding employees with the right technical and basic skills is also essential and the importance of this issue has increased since 2012. Energy cost management and quality management declined in importance compared to 2012. Product development and design needs also increased. These trends are similar to what we have seen in our own MEP client survey over time.
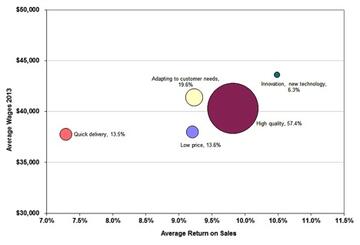
• Different business strategies lead to different bottom-lines. The most important finding from the survey is that innovation has a bottom-line benefit for companies and their employees. The following chart suggests that firms adopting a strategy of innovation have higher profitability and pay higher wages compared to firms adopting other strategies. While the chart suggests that “innovation” pays, it is not clear that causality runs from innovation to profitability or if firms that are more profitable have the luxury to be more innovative. However, the difference in the returns to different strategies has narrowed over time.
Chart: Returns to Different Business Strategies
• Manufacturers are introducing new and improved products and services. Under half of the respondents (48 percent) reported introducing a new or improved good or service within their establishment during the 2011-2013 period. Forty one percent of the respondents reported introducing a new or significantly improved product and 13.6 percent reported introducing a new or improved service. These new or improved goods and services were split between two types: 25 percent were reported as being introduced before other competitors and 26.3 percent were new to their facility but already available from competitors.
• New goods and services represented a modest portion of total sales. On average, about 13 percent of total sales came from goods and services that were new to the market (the median was 10 percent) and sales from goods and services new to the firm (but not the market) represented about 15 percent of their total sales (the median was also 10 percent) based on new goods and services introduced over the last three years.
• Firms introduced a range of other improvements as well in introducing new goods and services. Forty-eight percent of the respondents introduced a new or significantly improved process, 38 percent reported they adopted new or improved production technologies and techniques, 11 percent introduced new or improved logistics, delivery, or distribution methods, and 18 percent reported other improvements including improvements in purchasing, accounting, or maintenance processes.
• Firms engaged in innovation activities focused on their organization. Over half of the firms responding improved their strategic planning, restructured their management, and their relationships with other firms. Seventeen percent reported new or significant changes in corporate strategy while 18.6 percent implemented new or improved management systems. Just over one quarter of the respondents reported restructuring how work was organized (33.1 percent), and over 18 percent reported changing their relationship with other firms including new alliances, partnerships, outsourcing, and subcontracting.
• Research and development (R&D) expenditures represented about 3.7 percent of gross sales on average. Over the past 12 months, the average firm invested over $2.7 million in various R&D activities (the median was $105K). The average amount spent on in-house R&D was just over $1.8 million (but the median was only $5K), external R&D averaged about $22K (median was zero), acquiring new machinery, software, and equipment averaged about $718K (median was $30K), and other innovation expenditures averaged about $165K (median was zero).
• Just under a quarter of the respondents indicated that they cooperated with other firms or institutions to advance innovation. The most common type of open innovation involved working with suppliers and customers. Interestingly, 8.5 percent of the firms reported that they collaborated with universities or other higher education institutions, and 7.3 percent reported collaborating with private consultants, commercial labs, or private R&D institutions. Less than 2 percent of the companies said they collaborated with government labs on innovation activities.
• Nearly half of the respondents reported some export sales and one fifth reported that export sales increased from 2011 to 2013. Exports are small but a growing source of sales. The average firm reported that about 7 percent (the median was zero) of total sales were exported outside the US in 2013 while about 6 percent of total sales were exported outside the US in 2011.
• Three in ten respondents reported making no investments in employee training. Of firms reporting investments in employee training, a small portion was spent on training on new tasks and activities. The median firm reported spending about $423 per employee annually on training while the typical high performing firm spent about $527 per employee annually. Eight percent of the typical Georgia manufacturers’ total employment consists of temporary workers. These data provide a look inside manufacturing firms and their activities. The survey focuses on activities and outcomes in areas including innovation, growth, and many other issues including sustainability practices, workforce investments, and the adoption of new manufacturing processes and tools. It is worth scanning the report to see how your firm stacks up or to see where things stand for a cross section of firms. Whether these can be generalized beyond Georgia is difficult to say, but they provide a potential benchmark for firms and centers to consider and a survey tool to use by others.