
Official websites use .gov
A .gov website belongs to an official government organization in the United States.
Secure .gov websites use HTTPS
A lock (
) or https:// means you’ve safely connected to the .gov website. Share sensitive information only on official, secure websites.
Process Mapping
The National Institute of Standards and Technology (NIST), through its Organization of Scientific Area Committees (OSAC) and partnership with NIJ, has been working with practitioners in various forensic science disciplines to produce process maps that identify key decision points in the forensic evidence examination process. Process mapping visually represents the critical steps and decision points of a workflow, allowing others to understand a process and its components more clearly, and revealing areas of improvement.
These process maps are intended to be used to help improve efficiencies while reducing errors, highlight gaps where further research or standardization would be beneficial, facilitate root cause analyses, and assist with training new investigators. It may also be used by laboratory managers to better understand how their protocols compare with those of other laboratories and provide a framework for developing standard operating procedures, best practice documents, and quality assurance measures.
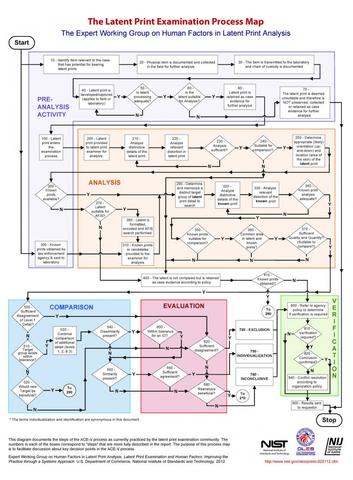
Conventional Process Maps
Traditionally, process maps are static 2D visual guides that use standard flow chart shapes to describe key decisions in forensic analysis.
- Fire Investigation *NEW*
- Seized Drugs
- Human Forensic DNA Analysis
- Footwear & Tire Examination
- Firearms
- Friction Ridge (2019)
- Handwriting
- Speaker Recognition
- Friction Ridge (2012)
Interactive Process Maps
NIST is developing interactive process maps that take static 2D maps and integrate linked content such as standards, training materials, images, and videos to provide a more comprehensive view of each decision and step made within a forensic analysis.
Contacts
-
(301) 975-6363