
Official websites use .gov
A .gov website belongs to an official government organization in the United States.
Secure .gov websites use HTTPS
A lock (
) or https:// means you’ve safely connected to the .gov website. Share sensitive information only on official, secure websites.
GSAS Tutorial - Assessment
Leslie Struble (University of Illinois) and Paul Stutzman (National Institute of Standards and Technology)
Version 1 (March 2015)
Assessment
This section provides guidance to help you assess your results before you move on to the next step.
The phase composition of the SRM clinker is included in the certificate [14] provided when the clinker is purchased from NIST. Values from the SRM certificate along with the uncertainties are listed in Table 2. The phase composition of the proficiency cement samples determined from an ASTM interlaboratory study [15] are listed in Table 3.
| Table 2. Phase composition for the SRM 2686a clinker [14]. | |
| Phase | Mass Fraction, 2s uncertainty (%) |
| Alite | 63.35±1.29 |
| Belite | 18.68±1.42 |
| Aluminate | 2.46±0.67 |
| Ferrite | 10.76±1.44 |
| Periclase | 3.40±0.40 |
| Alkali Sulfates | 0.87±0.27 |
| Table 3. Phase composition for the proficiency cements [15]. | ||
| Phase | Cement A | Cement B |
| Mass Fraction (%), mean ± 1 standard deviation | ||
| Alite | 59.9±2.7 | 63.5±2.3 |
| Belite | 16.8±2.6 | 12.1±2.2 |
| Aluminate | 4.3±1.6 | 3.5±1.2 |
| Ferrite | 9.8±1.7 | 10.1±1.2 |
| Periclase | 1.0±0.3 | 1.4±0.3 |
| Arcanite | 0.7±0.5 | 0.2±0.2 |
| Aphthitalite | 0.0±0.1 | 0.1±0.1 |
| Anhydrite | 1.2±0.8 | 0.1±0.2 |
| Bassanite | 1.8±0.9 | 0.2±0.3 |
| Gypsum | 0.9±1.2 | 5.1±1.7 |
| Calcite | 2.7±1.1 | 2.5±1.0 |
| Lime | 0.1±0.2 | 0.2±0.3 |
| Portlandite | 0.3±0.6 | 0.7±0.8 |
| Quartz | 0.0±0.1 | 0.0±0.1 |
Students at University of Illinois in CEE501 (a graduate course) performed a laboratory exercise following these instructions and their lab reports formed the basis for the following comments on assessment. They did not, however, analyze either SAM or KOH-S extraction residues of clinker or cement.
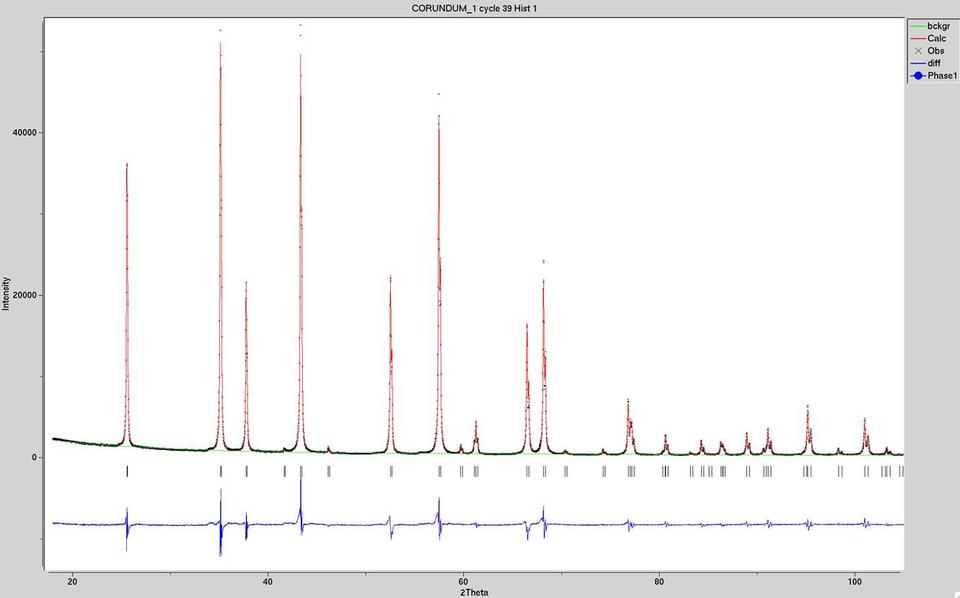
Analysis of a single phase with refinement of crystal structure parameters and instrument parameters should produce a very good fit. An example, periclase, is shown in Figure 1. This had a Χ2 of 21.8, a fairly high value, though the figure shows a good fit. Another example, corundum, is shown in Figure 2. This had a Χ2 of 13.6. One would expect for these samples a somewhat lower Χ2, perhaps below 2.0, but the fits shown are satisfactory for this exercise.
Figure 1: Refinement of the single phase periclase.
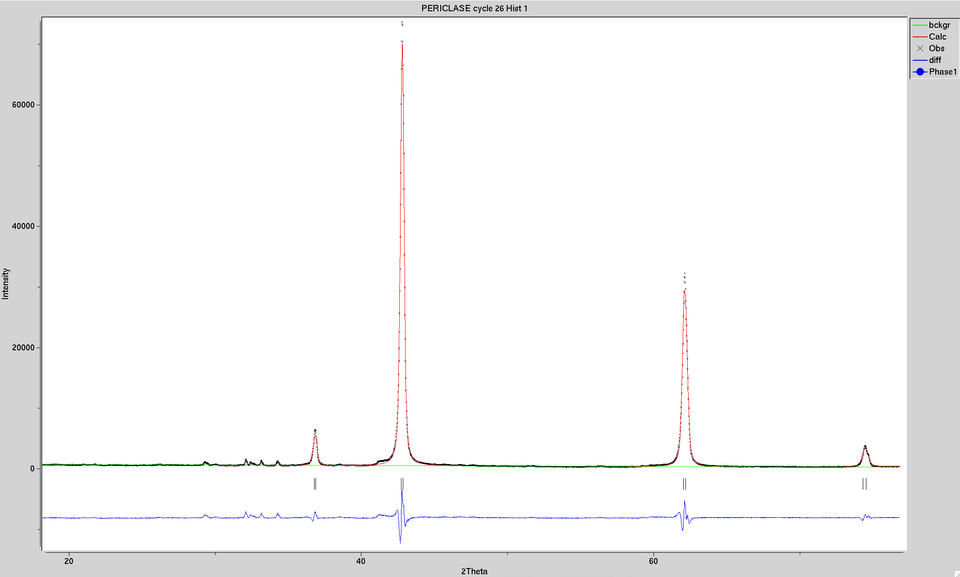
Figure 2. Refinement of the single phase corundum.
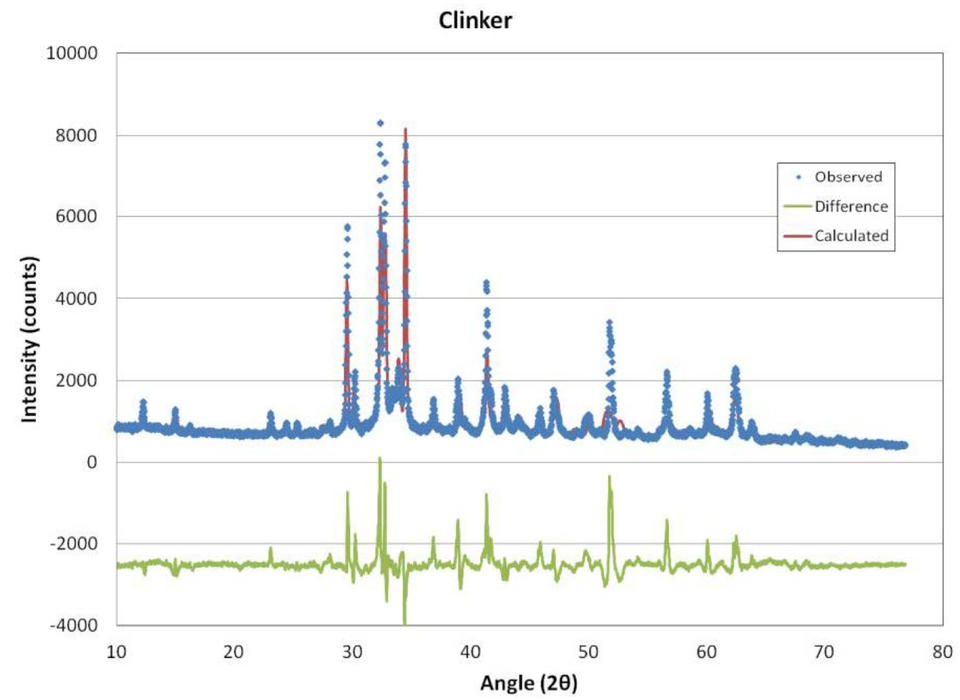
Analysis of complicated mixtures such as clinker and cement is much more difficult. An example of a poor fit of the SRM clinker is shown in Figure 3 and Table 4. It is evident from the plot and even more evident from the quantitative results that the fit is poor. The Χ2 was 26.7, high but not that much higher than the fits above. Taylor [9] provides typical ranges for clinker phase concentrations, with alite comprising 50 % to 70 % by mass, belite 15 % to 30 % by mass, aluminate 5 % to 10 % by mass, and ferrite 5 % to 10 % by mass. Periclase may occur up to about 6 %, the alkali sulfates may occur up to a few percemt, and the calcium sulfates may be present up to 5 %. Calcite may also be included in cements up too 5 %. These ranges can vary depending upon the clinker or cement, but they do provide a sense of what to expect and results that deviate, such as those in Table 3, bear additional attention. Nonetheless, refinement of this pattern should be continued before any conclusions are drawn. Unfortunately, the student experienced problems with the program when attempting further refinements.
Figure 3. Refinement of SRM clinker based upon a single measurement.
| Table 4. Phase analysis for a single clinker analysis in Figure 3. | |
| Phase | Mass Fraction (%) |
| Alite | 10.68 |
| Belite | 43.52 |
| Aluminate | 0.00 |
| Ferrite | 11.82 |
| Periclase | 33.83 |
| Arcanite | 0.15 |
| Aphthitalite | 0.00 |
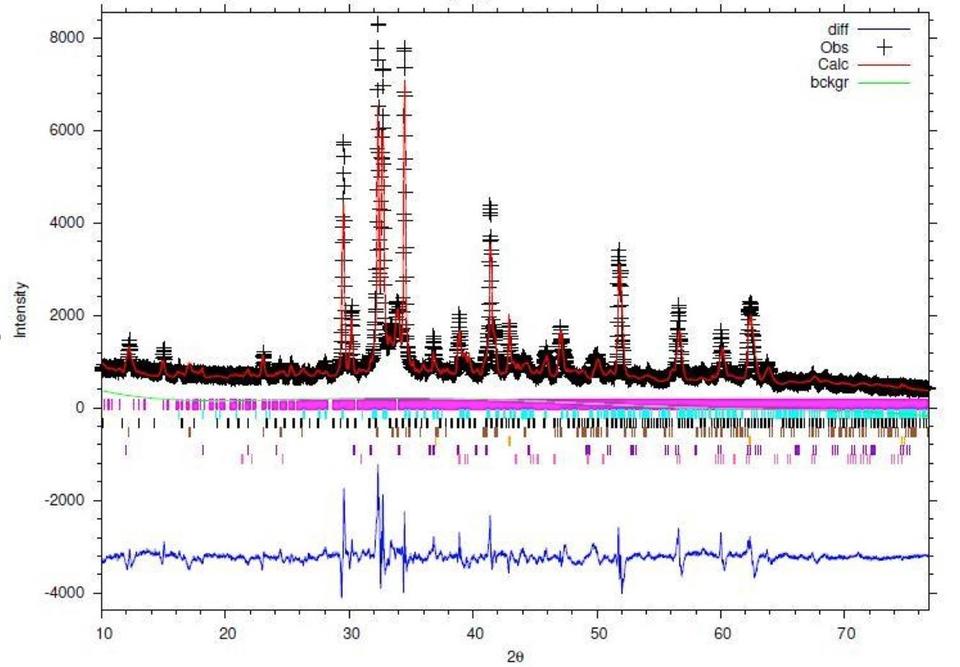
A better fit is shown in Figure 4 and Table 4, also of the standard reference clinker. The Χ2 was 13.8, still quite high, but a much better fit than in Figure 3. And the phase fractions in Table 4 are much more sensible than those in Table 3. With additional experience, the fitting will be improved, but these results are within the specified range for each phase.
Figure 4. Refinement of SRM clinker.
| Table 4. Phase analysis for a single clinker analysis in Figure 4. | |
| Phase | Mass Fraction (%) |
| Alite | 65.20 |
| Belite | 16.85 |
| Aluminate | 1.00 |
| Ferrite | 12.25 |
| Periclase | 4.66 |
| Arcanite | 0.05 |
| Aphthitalite | 0.12 |