
Official websites use .gov
A .gov website belongs to an official government organization in the United States.
Secure .gov websites use HTTPS
A lock (
) or https:// means you’ve safely connected to the .gov website. Share sensitive information only on official, secure websites.
Reading Between the Lines in Lithium: New measurements of unprecedented accuracy resolve a longstanding data disagreement problem
The investigators took high-precision measurements of the D1 and D2 transition lines in the two stable isotopes of lithium.
A team of PML researchers has solved a longstanding problem plaguing experimental tests of the atomic theory of lithium, and in the process uncovered a surprising and powerful effect overlooked in interpreting the results of previous experiments.
They did so by making the first high-precision measurements of differences in spectral emissions from the two stable isotopes of lithium, 6Li and 7Li, using recently developed frequency comb techniques. Theory makes extremely accurate predictions about the differences in those emissions, and "a lot of previous experiments have tried to confirm the correctness of the theory," says Craig Sansonetti, who led the research. "But the data were all over the place, the range of differences was as large as the signal they were attempting to measure, and they didn't even agree on the sign." Overall, "the disagreement between theory and experiment was as large as 16 standard deviations."
That situation has serious repercussions, because top theorists have proposed that the differences in the emissions can be used to probe isotopic differences in the charge radius of the lithium nucleus. This is of intense interest because Li is the most complex atom for which the atomic structure can be calculated from first principles with sufficient accuracy to be sensitive to this subtle nuclear effect. As a result, "it is a benchmark system for validation of theory," Sansonetti and colleagues write in a July 2011 paper* in Physical Review Letters describing the results.
Further adding to its allure, lithium is one of a handful of elements with an isotope (in this case, 11Li, with a half-life of 8.75 ms) that has an exotic "halo nucleus" in which some neutrons are so loosely bound to the nucleus as to be quasi-independent. The effect of these loosely bound neutrons on the charge radius of the nuclear core has long been recognized as a matter of interest for nuclear theory, but no conventional scattering measurement has been made for this rare and short-lived isotope. The isotope shift method offers an attractive alternative with the prospect of higher accuracy in determining the nuclear size. "To make sure we understand 11Li ," Sansonetti says, "we need confirmation of theory for the stable isotopes, where independent scattering measurements of the nuclear size are available."
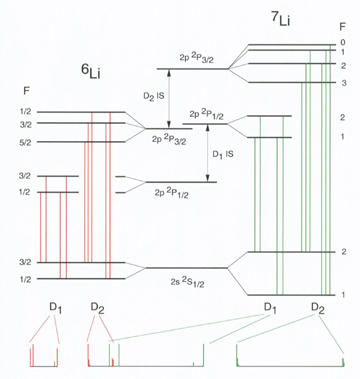
The PML team used a laser to excite a collimated beam containing both 6Li and 7Li atoms, and watched for the telltale light emission that occurs at a particular pair of atomic transitions. These two spectral signatures - designated as the D1 and D2 lines - occur at a slightly different frequency for 6Li and 7Li, and the team measured the shift between the two frequencies.
To determine that shift as exactly as possible, the researchers took measurements by calibrating their data with a high-precision frequency comb that was tied to a cesium clock and accurate to a few parts in 1013.
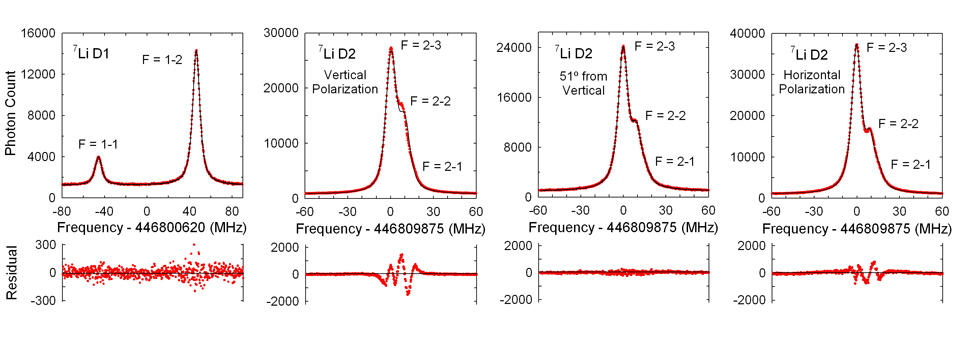
The experimental data were of two types: the D1 measurements, in which the transition signals were very clearly and sharply resolved, and were a near-perfect fit to theoretical predictions; and the D2 data, much of which was poorly resolved, and were not accurately modeled by theory. The apparent reason, Sansonetti says, is that "most of the D2 lines are unresolved blends of three hyperfine components of the fine-structure transition, and the spacing of the hyperfine components is less than the natural width of the line," which is about 5.87 MHz. Presumably some quantum interference among the three hyperfine transitions was distorting the result.
"So we started looking into what is the source of this problem," Sansonetti says. "What we found out, after a good deal of trial and error, was that if we used a wave plate to vary the polarization of the incoming laser light, we changed the shape of the observed profile, and that is something no one had considered in any of the previous experiments. Further, the apparent position of the D2 transitions shifted by as much as 50 times the experimental accuracy." By changing the polarization, the PML team found they could in effect fine-tune the laser beam to nearly eliminate the interference between the hyperfine components. It turned out that the minimal interference occurred at slightly over 50 degrees from vertical.
But why did that happen? The answer finally arrived thanks to the kind of in-house collaborations that the PML network makes possible. "I knew that there were theorists over in Bill Phillips' [laser cooling and trapping] group, so I called and said 'I'd like to show you what we've got and ask if anybody over there can give us some help in understanding this.' "Shortly thereafter, he was explaining the polarization results to Phillips and Trey Porto. "And Trey said, 'I think I've already got a program that, with very minor modifications, can probably calculate this.' That same afternoon, I went over there and he produced qualitatively the same thing we saw in the lab," Sansonetti says.
The polarization-adjusted data were an excellent fit to theory, and the team's results agree with the latest and presumably best theoretical predictions. "I've been doing laser spectroscopy for a lot of years," Sansonetti says. "Previously we've always done the measurements through optical interferometry, and we were limited to an uncertainty of about a part in 109." The new results were good to three parts in 1011. "The nearly two orders of magnitude in accuracy we gained by going to frequency based metrology was essential to the success of this experiment."
* "Absolute Transition Frequencies and Quantum Interference in a Frequency Comb Based Measurement of the 6,7Li D Lines,"Craig J. Sansonetti1, C. E. Simien, J. D. Gillaspy, Joseph N. Tan, Samuel M. Brewer, Roger C. Brown, Saijun Wu, and J. V. Porto, Phys. Rev. Lett. 107, 023001 (2011).