
Official websites use .gov
A .gov website belongs to an official government organization in the United States.
Secure .gov websites use HTTPS
A lock (
) or https:// means you’ve safely connected to the .gov website. Share sensitive information only on official, secure websites.
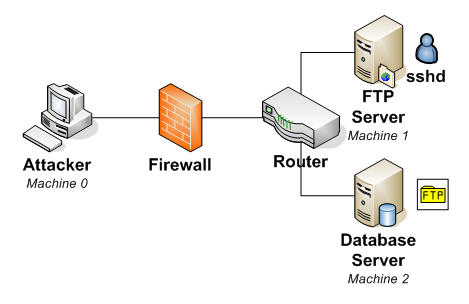
The example illustrates three paths that an attacker can take to penetrate the network using FTP server, SSH server or database server.
Data breaches are a recurring nightmare for IT managers responsible for securing not only their company's confidential data, but possibly also sensitive information belonging to their clients, such as social security numbers or health or financial records. To help managers safeguard valuable information most efficiently, computer scientists at the National Institute of Standards and Technology (NIST) are applying security metrics to computer network pathways to assign a probable risk of attack to guide IT managers in securing their networks.
"We analyze all of the paths that system attackers could penetrate through a network," says computer scientist Anoop Singhal, "and assign a risk to each component of the system. Decision makers can use our assigned probabilities to make wise decisions and investments to safeguard their network." The research was presented at a conference earlier this month.
Computer networks are made up of components varying from individual computers, to servers and routers. Once inside a network's firewall, for a seemingly mild-mannered purpose as posting an image to a file transfer protocol (FTP) site, a hacker can travel through the network through a variety of routes to hit the jackpot of valuable data. In addition to hardware, the hacker can break in through software on the computers, especially file-sharing applications that have been blamed for some major data breaches recently.
NIST researchers evaluate each route and assign it a risk based on how challenging it is to the hacker. The paths are determined using a technique called "attack graphs." A new analysis technique based on attack graphs was jointly developed by Singhal and research colleagues at George Mason University. A patent is pending on the technique.
Singhal and his team determine risk by using these attack graphs and NIST's National Vulnerability Database (NVD). This government repository includes a collection of security-related software weaknesses that hackers can exploit. NVD data was collected from software vendors and scores are assigned from most to least insecure by experts.
For example in a simple system there is an attacker on a computer, a firewall, router, an FTP server and a database server. The goal for the attacker is to find the simplest path into the jackpot—the database server. Attack Graph Analysis determines three potential attack paths. For each path in the graph, the NIST researchers assign an attack probability based on the score in the NVD database.
Because it takes multiple steps to reach the goal, the probabilities of each component are multiplied to determine the overall risk. One path takes only three steps. The first step has an 80 percent chance of being hacked, the second, a 90 percent chance. The final step requires great expertise, so there is only a 10 percent probability it can be breached. By multiplying the three probabilities together, that path is pretty secure with a less than 10 percent chance of being hacked.
The next step is for the researchers to expand their research to handle large-scale enterprise networks.
L. Wang, T. Islam, T. Long, A. Singhal and S. Jajodia. An Attack Graph Based Probabilistic Security Metric. IFIP WG 11.3 Conference on Data and Application Security, London, United Kingdom.