
Official websites use .gov
A .gov website belongs to an official government organization in the United States.
Secure .gov websites use HTTPS
A lock (
) or https:// means you’ve safely connected to the .gov website. Share sensitive information only on official, secure websites.
Society is increasingly concerned about exactly how much carbon dioxide and other pollutants are coming out of smokestacks. But current measurements are clouded with uncertainty, in part because calibrating the flow monitors* installed in smokestacks turns out to be a highly complicated business in which small variations in several factors can lead to large potential error.
To simulate turbulent gases in a power-plant smokestack, NIST researchers employ flapping fabric.
Furthermore, carbon dioxide emissions travel across international boundaries; therefore worldwide reduction in such emissions will require reaching an international consensus on measurement methods.
Scientists in NIST's Physical Measurement Laboratory have begun a long-term research effort to improve the accuracy of carbon dioxide measurements by studying the behavior of calibration instruments – typically different sorts of pitot tubes** – which measure air speed by detecting the pressure created by the flow. While they are temporarily inserted into smokestacks, their readings are compared to those from flow monitors already installed in the stacks that continuously track the emissions of presently regulated pollutants: sulfur dioxide, nitrogen oxides, and mercury.
Today there are no rules that require the calibration of pitot tubes. Nor is it clear how that should be done. So NIST physicists Iosif Shinder, Vladimir Khromchenko, and colleagues are studying the effects of gas velocity, turbulence, and alignment of the pitot tubes by measuring them in NIST's wind tunnel.
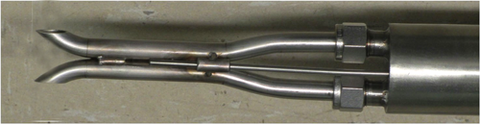
For smokestacks, the workhorse calibration tool is a specific type of pitot tube called an S-probe (see photo at bottom). Given the swirling flows in a large smokestack, the alignment of the S-probes may deviate from the average flow. But how much deviation would produce how much variation in the readings was not known. To answer that question, Shinder says, "we had to design an apparatus that could place the tubes in various orientations."
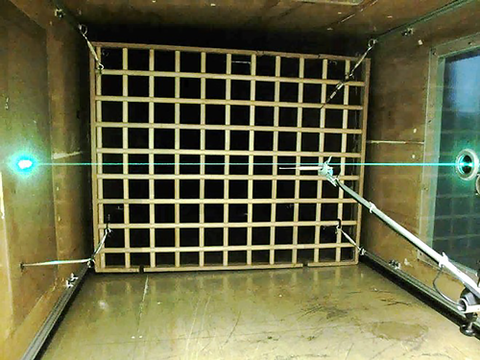
Shinder and colleagues developed an automated system, one of the first of its kind, to move the pitot tubes in the wind tunnel by incremental steps in three dimensions. The tubes' readings are compared with measurements taken simultaneously with NIST's working standard for velocity measurements, a laser Doppler anemometer. (See photo at left.)
In recent research, conducted in collaboration with the national metrology institutes of Taiwan, China, and Korea, NIST researchers determined that a change in the tube's pitch angle by 15 degrees from the direction of flow could cause calibration factors to be incorrect by as much as 12%. The swirling flows in some smokestacks generate such large pitch angles.
"But pitch and yaw are not the only significant variables," Shinder says. "The calibration factor also depends on the airspeed itself. It takes about 5,000 measurements to characterize a pitot tube that simultaneously measures air speed, pitch angle, and yaw angle."
Finally, the readings from the tubes depend on the intensity of the turbulence in the flow. How intense? There is no benchmark. When they began the research, Shinder says, they were unable to find any data about what kinds and levels of turbulence actually occur in smokestacks.
"It appears that it could be around 20%, but we just don't know," he says.
Generating turbulence in NIST's wind tunnel (a 10-meter by 50-meter closed loop in which flow velocity can reach 75 meters per second, equivalent to a Category 5 hurricane) requires that something be placed in the tunnel that will cause chaotic swirls and vortices in the moving air. Previous studies had used wooden and metal grids (see photo), and Shinder used those as well. But the grid could only generate up to about 10% turbulence – the amount of deviation from steady flow.
To get higher intensities, he would need something different. Custom-made, computer-controlled turbulence generators are expensive. So Shinder and Khromchenko began to experiment with different arrangements of wire grids onto which he tied pieces of fabric that flap in the air stream. To vary conditions, the grid could be moved closer to or farther from the pitot tube. In that setup, turbulence intensity depends on distance between grid and sensor, and the dimensions of the grid mesh.
The fabric system was able to generate up to 25% turbulence – at the high end of what is thought to occur in a real stack – which allowed the scientists to take measurements at a range of intensities.
"We have only begun this line of research," Shinder says. "Eventually we want to be able to characterize S-probes, 3D probes, and other 3D sensors to bring a much higher degree of accuracy to emission measurements.
"The old methods were adequate when uncertainties in the range of 15% were acceptable," Shinder continues. "But now we need to do much better, especially if facilities eventually have to pay taxes on carbon dioxide flux."
* Power plants are required to report their total emissions, generally calculated by multiplying the gas velocity times the area of the smokestack. The result yields the volume of gas emitted per unit time. A typical flow monitor employs two transmitter/receiver units placed at different elevations in the stack. A sound signal traveling from one to the other is speeded up if it travels in the direction of the gas flow, or slowed down if it travels against the flow. The difference in transit times is used to calculate velocity.
** In its simplest form, a pitot tube is a tapered cylinder with a small hole in the end facing the flow of air or gas. It measures fluid velocity by detecting the pressure that builds up in the tube; the faster the flow, the higher the pressure. That reading can then be mathematically converted into a velocity reading.
The S-probe commonly used to calibrate smokestack flow monitors has two tubes, with holes facing in opposite directions. One measures the upstream pressure of the air; the other measures the downstream pressure. The difference is proportional to the gas velocity.