
Official websites use .gov
A .gov website belongs to an official government organization in the United States.
Secure .gov websites use HTTPS
A lock (
) or https:// means you’ve safely connected to the .gov website. Share sensitive information only on official, secure websites.
Simulated Chromatographic Data
The following information is provided as an aid in the validation of mathematical models used in quantitation with chromatographic data. This data may also be useful in characterizing chromatographic data system functionality and for teaching or training purposes to demonstrate chromatographic quantitation models. Data are provided in individual files that are packaged together in grouped zip files. Simulated chromatograms are provided as x,y text files and as corresponding *.cdf files. Data sets were generated mathematically using a Gaussian peak shape model, and peak areas are known exactly. The individual files are designated as "calibrants" or as "samples." Not all components are present in all separations; however, the first component is present in all data sets to permit its use in internal standard calculations. The components in data sets designated as "calibrants" are fully resolved. Some of the components in data sets designated as "samples" may partially co-elute. Quantity information and graphical representations (i.e., chromatograms) are provided in the included documentation. The simulations incorporate the following qualities:
1) Well resolved and partially coeluting components
2) Known component levels
3) Known resolutions
4) Baseline drift (low-frequency noise)
5) Noise (noise at sampling rate)
6) Matched "background" blank
7) Different sampling rates
8) Different chromatographic efficiencies.
"Calibration" and "sample" simulation data can be imported into chromatographic data systems to demonstrate the quantitation algorithms of the software. The data may be useful in evaluating how baselines should be set for unresolved components and for drifting or noisy data (i.e., valley-to-valley vs drop vertical, skimmed rider, full peak deconvolution, etc). The effect of baseline subtraction can also be evaluated.
Uses
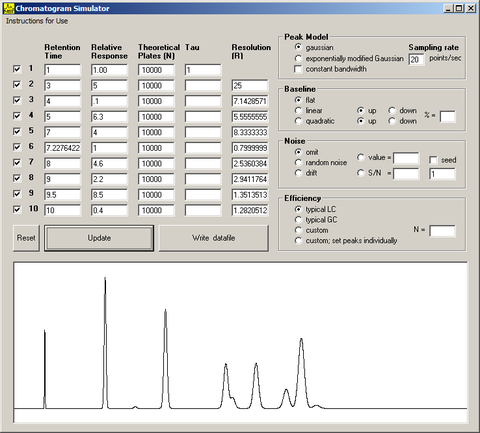
The Visual Basic program used to generate these data is provided to permit creation of additional data sets. Values entered for relative responses correspond to peak areas in the simulated chromatograms, using the Gaussian peak model. The exponentially modified Gaussian peak model is provided for qualitative use, and may be useful in graphical demonstration of nonideal chromatographic behavior. The program permits the addition of multiple contributions to the simulated data including noise and baseline effects, which may be useful in evaluating baseline algorithms for chromatographic data systems.
