Official websites use .gov
A .gov website belongs to an official government organization in the United States.
Secure .gov websites use HTTPS
A lock (
) or https:// means you’ve safely connected to the .gov website. Share sensitive information only on official, secure websites.
Monthly Results Sep 2015
During September 2015, the NZERTF consumed 960 kWh of electrical energy. The solar electric photovoltaic system generated 1260 kWh of electricity during the month. The difference between the energy produced by the solar photovoltaic system and the energy consumed by the NZERTF, 300 kWh, was exported to the electric grid. A graphical representation of the energy consumed and generated is found in the year to date results.
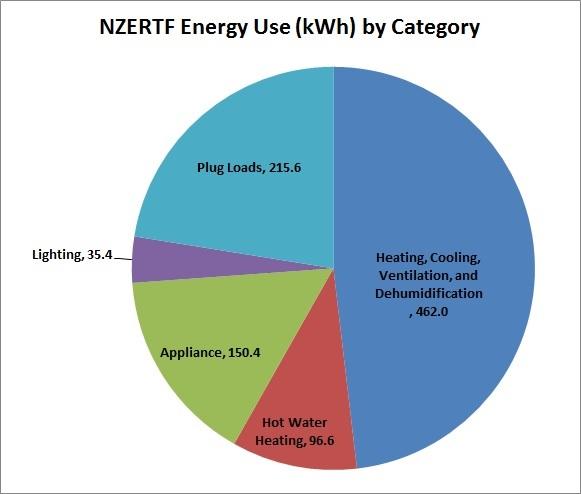
The following chart breaks down the total energy consumed by the house into the various end uses. For the month of September 2015 the greatest energy end use was for space conditioning to maintain the house at 75 F +/- 1 F (21.1 C +/- 0.5 C) followed by plug loads. The third largest end use was appliances.
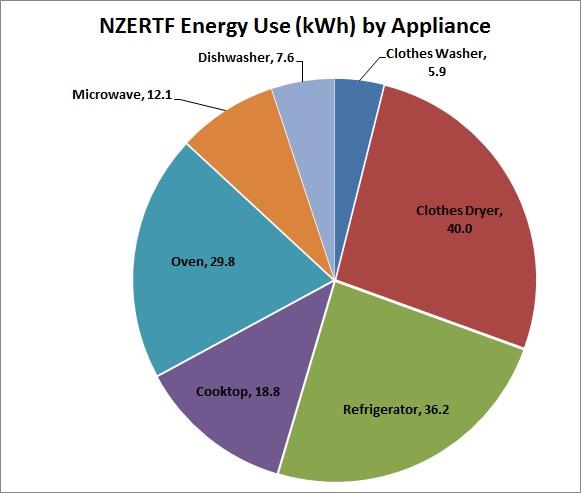
A breakdown of the appliance end use into the energy consumed by individual appliances is captured in the following pie chart. During the month of September 2015 the greatest appliance energy usage was associated with the clothes dryer.