
Official websites use .gov
A .gov website belongs to an official government organization in the United States.
Secure .gov websites use HTTPS
A lock (
) or https:// means you’ve safely connected to the .gov website. Share sensitive information only on official, secure websites.
NIF - Neutron Tomography (3-D imaging)
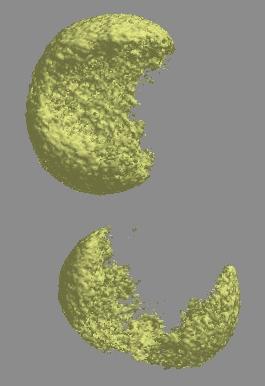
By rotating an object 180 degrees, and taking neutron radiographs at defined angular positions, a complete 3-Dimensional image of the object’s composition can be made. The technique is similar to CAT scans, and is based on the Filtered Back Projection Algorithm. The NIF has the capability to acquire, reconstruction, render and analyze tomographic image sets. Shown in the figure is the result of a SURF summer project investigating the affects of aflatoxin on corn kernels with neutron tomography. The fungus reduces the hydrogen content in specific anatomical regions, and neutron tomography can distinguish these regions, and diagnosis whether or not a kernel has been infected.
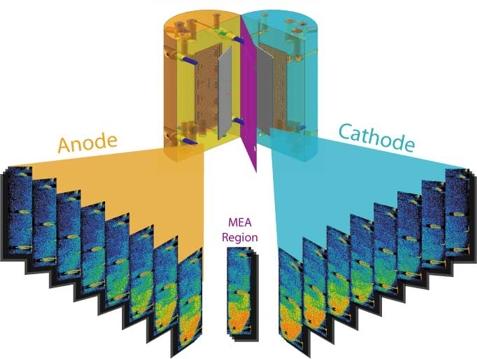
A major restriction of tomographic imaging is the time it takes to collect a complete data set. For instance, during the image acquisition, the object must remain in the same state, or else there will be blurring in the reconstructed image. While this is no problem for static objects, like the corn kernels above, it can be a major challenge for operating fuel cells. With the NIF's a-Si flat panel detector, a tomographic image set of a specially designed fuel cell can be collected in about 20 minutes with a volume resolution (voxel) of (0.127 mm)3. This is a short enough time so that the fuel cell can remain in a nearly steady state. Using thick “soft goods” (thicker than would be used in automotive applications) it is possible to measure the water gradient along the thickness of the gas diffusion media. The image below shows the NIF's first attempt at tomographic image of an operating PEFC.
Contacts
-
(301) 975-6465
-
(301) 975-6207
-
(301) 975-4842