
Official websites use .gov
A .gov website belongs to an official government organization in the United States.
Secure .gov websites use HTTPS
A lock (
) or https:// means you’ve safely connected to the .gov website. Share sensitive information only on official, secure websites.
Cybersecurity Insights
a NIST blog

In previous posts we discussed different ways to implement differential privacy, each of which offers some trade-off between privacy and utility. But what does “utility” mean, and how do we know we are preserving it? To discuss this topic, we are delighted to introduce another guest author in our blog series, Claire McKay Bowen, Lead Data Scientist for Privacy and Data Security at the Urban Institute. Claire’s research focuses on assessing the quality of differentially private data synthesis methods and science communication. In 2021, the Committee of Presidents of Statistical Societies identified her as an emerging leader in statistics for her technical contributions and leadership to statistics and the field of data privacy and confidentiality.
- Joseph Near and David Darais
Being a privacy researcher, I am often asked, “How do you ensure that any publicly released differentially private data or statistic will still produce valid results? How do you balance this against the disclosure risks or privacy needs?” Most people who ask these questions expect a one-size-fits-all utility metric that perfectly assesses the quality of any publicly, differentially private data or statistic. But, such a metric doesn’t exist in general.
Instead of seeking the ultimate utility metric, we should ask ourselves, “Who are the data practitioners or data users, and what will they use the data and statistics for?” In other words, privacy researchers should consult and establish data-quality metrics based on how other researchers, institutions, and government agencies will use the data and statistics.
However, determining which specific metrics to apply is itself an entire research field. It is impossible to predict all possible analyses that data users might implement and ensure the data will provide valid results for each of those analyses. This means privacy researchers must have open discussions with data practitioners about which utility metrics are right for evaluating the altered data quality, because every dataset and use for that data is unique.
Utility Metrics
To provide some guidance, I will cover several use cases of what utility metrics privacy researchers and data users implemented. Note that these examples only cover a few of many other types.
Summary Statistics
Many privacy researchers will first examine the summary statistics of the anonymized data as a quick and easy starting point for assessing utility. Also, most data practitioners can easily understand and interpret summary statistics compared to other utility metrics. For example, common summary statistics measure how well the released data preserve the counts, means, and correlations for each variable or combination of variables. The privacy expert then reports the distance between the original and noisy results. Typically, these distance measures are bias and root mean squared error.
As an example, for the 2020 Census, the United States Census Bureau announced the following utility measures and how they defined them:
- mean absolute error,
- mean numeric error,
- root mean squared error,
- mean absolute percent error,
- coefficient of variation,
- total absolute error of shares, and
- percent difference thresholds equaling the count of absolute percent difference above a certain threshold
Mean absolute error, for example, is the “average absolute value of the count difference for a particular statistic” and is calculated as the absolute value of the difference between the anonymized data and the confidential data results. These measures are averaged across geographies, because most data practitioners want these values at certain geographies, such as census-tracts.
Outcome-Specific Analyses
Privacy researchers should then ask the data users what analyses they typically implement as another measure for data quality. The idea is data users should make a similar decisions regardless if the analysis output came from the altered data or confidential data. The privacy community refers to this type of utility measure as an outcome-specific metric.
For instance, many public policy research institutions, such as the Urban Institute, implement microsimulation models to determine how new tax policy plans will affect Americans. These models first estimate a baseline from current economic conditions in the United States and then calculate a counter factual or an alternative estimation based on the proposed policy program change. The difference between the baseline and the counterfactual estimates reveals the impact of the public policy program.
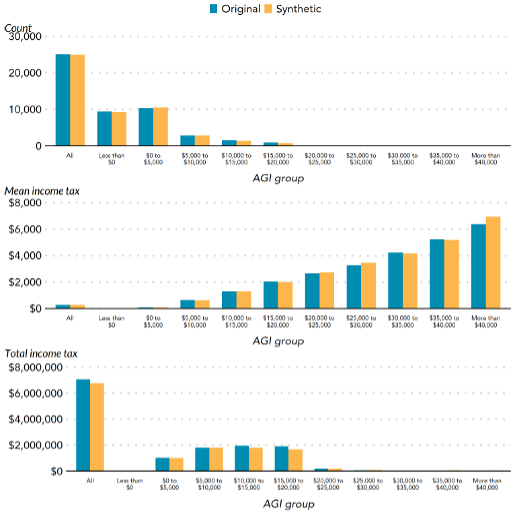
In 2020, the Urban Institute partnered with the Statistics of Income Division at the Internal Revenue Services to create a synthetic dataset (i.e., pseudo records that are statistically representative of the original data) and implemented a tax microsimulation model to evaluate the quality of the synthetic file. The model calculated the estimated adjusted gross income, personal exemptions, deductions, regular income tax, and tax on long-term capital gains and dividends on the confidential and altered data. Figure 1 shows the results for calculating the adjusted gross income, where the results from the original and synthetic data are close.
Figure 1. The results for calculating the different adjusted gross income groups for count, mean income tax, and total income tax based on the original and synthetic tax data from Bowen et al. (2020). AGI stands for adjusted gross income.
Similarly, in 2021, the Urban Institute conducted an extensive feasibility study on several differentially private methods for releasing tabular statistics, mean and quantile statistics, and regression analyses with cross-sectional data. They focused on these types of analyses based on informal interviews with several tax experts. Also from these interviews, they evaluated the differentially private methods based on their impact on analyses for making public policy decisions. Finally, the authors noted which methods worked in theory with specific conditions, but would run into issues in practice when consulting the tax experts.
Marginal Distributional Metrics
Another approach is to measure the distributional distance between the original and altered data. Some privacy researchers apply the Chi-square test for categorical variables and the Kolmogorov-Smirnov test for continuous variables. As an example, Bowen and Snoke (2021) compared several differentially private synthetic data for the 2018 Differential Privacy Synthetic Data Challenge. Specifically, the authors reported the p-value as a scale-free distance measure rather than the traditional null hypothesis significance testing, where a higher p-value indicates a higher utility. This adjustment allows researchers to compare the original and differentially private synthetic data that had different number of observations and variables with different scaling.
Global Utility Metrics
Using global utility metrics or discriminant-based algorithms is another way to evaluate data quality that is becoming more popular in literature but is not commonly used or adopted by any federal agency (as far as this author is aware of). The global utility metrics attempt to measure how close or similar the anonymized data are to the confidential data.
A simple example would be comparing two anonymized, education datasets, one with 10 percent of records that have “less than high school” education and one with 13 percent, where the former is closer to the confidential data value of 9 percent. Most global utility metrics compare against several variables rather than one or two.
At a high level, global utility metrics first combine the confidential data with the publicly released data and mark each record as being from the confidential data or the anonymized, public data. Next, the privacy researcher must decide what classification model to use to discern whether a record is from the confidential or the anonymized data. If the classification model “struggles” to assign a record to either the confidential or public data, privacy researchers assume that the two datasets are similar. More specifically, each record receives a probability of being classified as being from the confidential data or the public data. A probability close to 50 percent means the classification model cannot predict any better than a coin flip.
Finally, depending on the global utility measure, the method distills those probabilities into a single value or multiple values to convey how similar the released data are to the original data. The “accuracy” depends on what classification model privacy experts use, because each classification model will measure different characteristics of the data. Privacy researchers need to conduct more scientific studies to fully understand these differences. They also need to explore how to make these methods more computationally efficient for the average data user.
Software Tools
What about code to implement these utility measures? Unfortunately, very few software tools exist to implement these utility metrics. One is synthpop, an R package that makes synthetic data of individual-level data that has some utility metrics, such as a global utility metric called pMSE-ratio. The privacy researchers that conducted additional utility metrics for the 2018 NIST Differential Privacy Synthetic Data Challenge posted their open-source code on GitHub, but are far from being robust, software quality code. Even though there is a demand for better utility metric software, some of the challenge in developing these tools is little funding and time to support this type of work.
Takeaway
It is impossible for privacy researchers and data practitioners to ensure the released data and statistics will provide valid results for all analyses. This is why they apply a suite of utility metrics to assess the quality of the differentially private data and statistics. They also try to focus on a few key analyses based on data user needs, to gain a more informative evaluation on the data quality and usefulness. These steps and constant conversations with data practitioners are necessary because there is no “one-size-fits-all”.
Coming Up Next
In this post we discussed a number of utility metrics for differential privacy which can be applied in a variety of use cases. In the next post we will turn our attention back to a particular use case: differentially private machine learning.
This post is part of a series on differential privacy. Learn more and browse all the posts published to date on the differential privacy blog series page in NIST’s Privacy Engineering Collaboration Space.